

Introduction to GA4 Ecommerce Reports (Monetization Reports).
Follow the steps below to access the various Ecommerce/Monetization reports in GA4:
Step-1: Login to your GA4 property.
Step-2: Click on ‘Reports’:

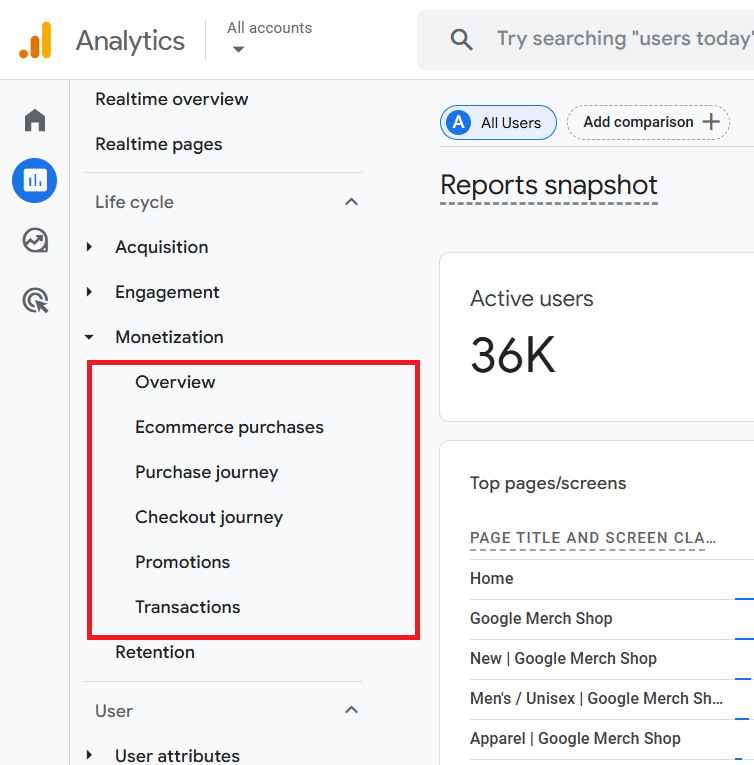
Step-3: Click on ‘Monetization’. You can now see the list of ecommerce reports available in GA4:
How to see data in GA4 Ecommerce Reports (Monetization Reports)?
By default, GA4 does not provide ecommerce data in its reports. The ecommerce data is available only when you have set up ecommerce tracking with all the recommended events and event parameters.
For example, Google recommends a certain set of events (also called ‘Online Sales’ events) and parameters for the Retail/ecommerce business vertical.

The following is the list of online sales events recommended by Google:
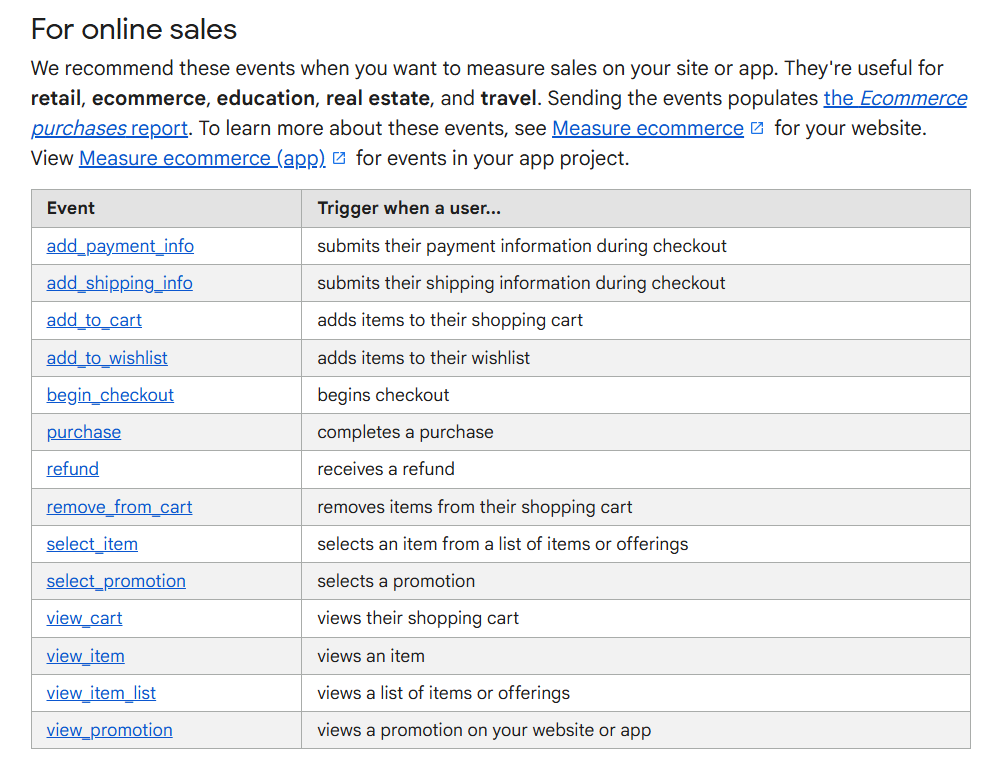
You need to ask your developer to fire these events on your website/app whenever a user performs a certain action.
If these events are not fired or are not fired correctly, then GA4 will report (not set) in the ecommerce reports.
List of various GA4 Monetization Reports.
The following are the various Google Analytics 4 Monetization Reports:
#1 Monetization Overview Report – This report provides an overview of ecommerce activity on your website.
#2 Ecommerce Purchases Report – This report provides information about the products you sell on your website.
#3 In-app purchases Report – This report provides information about the products you sell through your mobile app.
#4 Publisher ads Report – You can access your Google Adsense data in the ‘Publisher Ads’ report once you have linked your Adsense account with your GA4 property and more than 24 hrs have elapsed.
#6 Promotions Report – Through this report, you can determine the impact of each promotion on purchases and revenue.
#7 Purchase Journey Report – This report provides insights into the number of users who abandon the purchase process at each stage of your sales funnel.
#8 Order Coupon Report – This report shows the revenue associated with each coupon on your website or app. You can access this report only through the ‘Monetization Overview’ report.
#9 Item list Report – Through this report, you can measure the performance of item list. You can access this report only through the ‘Monetization Overview’ report.
#10 Checkout Journey Report – Through this report, you can optimize your checkout process. You can determine how users moved through the checkout funnel.
#11 Transactions Report – Through this report, you can see purchase activity at the order level so that you can understand revenue and items sold per transaction, not just in aggregate.
GA4 Monetization Overview Report
As the name suggests, the ‘Monetization Overview’ report provides an overview of ecommerce activity on your website.
You can access this report by navigating to Monetization > Overview in your GA4 property:

The top part of the Monetization Overview report shows ‘total revenue’, ‘purchase revenue’ and ‘total ad revenue’ metrics.
It also shows the data trend for each of these metrics once you click on a metric.
The following screenshot shows the data trend for the ‘Total revenue’ metric:

GA4 calculates the ‘Total revenue’ metric as the sum of revenue from purchases, subscriptions, and advertising.
The following screenshot shows the data trend for the ‘Purchase revenue’ metric:

GA4 calculates the ‘Purchase revenue’ metric as the sum of revenue from purchases made on your website and/or app, minus any refunds given.
Technically speaking, this metric is the sum of the ‘purchase’, ‘in_app_purchase’, ‘app_store_subscription_renew’, and ‘app_store_subscription_convert’ events minus the ‘refund’ events.
The following screenshot shows the data trend for the ‘Total ad revenue’ metric:

Note: In order to see the total ad revenue in your monetization reports, you would need to link your GA4 property with your Google Adsense account.
The middle part of the Monetization Overview report shows ‘total purchasers’, and ‘first time purchasers’ metrics. It also shows the data trend for each of these metrics once you click on a metric.
The following screenshot shows the data trend for the ‘Total purchasers’ metric:

GA4 calculates the ‘Total purchasers’ metric as the number of users that logged ‘purchase’ events for the selected time period.
The following screenshot shows the data trend for the ‘First time purchasers’ metric:

GA4 calculates the ‘First time purchases’ metric as the number of users that logged their first ‘purchase’ event.
When you scroll down further, the Monetization Overview report shows data trend for the ‘Average purchase revenue per user’ metric:

You can also see the list of the top items purchased during the selected time period:

The ‘Item name’ dimension denotes the name of the item purchased by your website/app user.
Google recommends that you pass values to this dimension by sending the item-level ‘creative_name’ parameter with the ‘view_promotion’ or ‘select_promotion’ event.
To see more details about the items purchased, click on the ‘View items’ link at the bottom of the card:

You should now see the ‘Ecommerce purchases’ report:

The ‘Ecommerce purchases’ report provides information about the products you sell on your website.
When you scroll down further, the Monetization Overview report shows the following three data cards:

The first data card allows you to see the items purchased by the item list name:

The ‘Item list name’ dimension denotes the name that you specified for a list of products you sell while setting up ecommerce tracking.
To see more details, click on the link ‘View item lists’:

You should now see the ‘Item List’ report:

Google recommends that you pass values to the ‘Item list name’ dimension by sending the item-level ‘item_list_name’ parameter through an online-sales event.
The second data card allows you to see the number of items that your customer viewed in a promotion:

To see more details, click on the link ‘View promotions’:

You should now see the ‘Promotions’ report:

Through the ‘Promotions’ report, you can determine the impact of each promotion on purchases and revenue.
The ‘Item promotion name’ dimension denotes the name you specified for a promotion while setting up the ecommerce tracking.
In the context of GA4 ecommerce tracking, promotions refer to internal promotions on your website, where you advertise one part of your website or app from another part of your website or app via banners or popups.
To track user engagement with your promotions and assess their effect on conversions, fire the ‘view_promotion’ and ‘select_promotion’ events on your website/app.
Also, make sure to include the event-level ‘promotion_id’ and ‘promotion_name’ parameters to help you identify the promotions that users interact with.
The third data card allows you to see the purchase revenue by order coupon:

To see more details, click on the link ‘View order coupons’:

You should now see the ‘Order Coupons’ report:

The ‘Order Coupons’ report shows the revenue associated with each coupon on your website or app.
The ‘Order Coupon’ dimension denotes the coupon name or code that you specified for discounted items while setting up ecommerce tracking.
Google recommends that you pass values to the ‘Order Coupon’ dimension by sending the event-level ‘coupon’ parameter with an online-sales event.
If you do not populate the ‘Order Coupon dimension’ while setting up ecommerce tracking, GA4 will report (not set) as the value of the ‘Order Coupon dimension’:

The bottom part of the Monetization overview report shows the following two data cards:

The first data card shows product revenue by Product ID for in-app purchases.
You would need to set up mobile app tracking for this data to appear on your data card.
The ‘Product Revenue’ dimension includes ‘In-App Revenue’, ‘Ecommerce Revenue’, ‘App Subscription’s, and ‘Virtual Currency Spent’.
For more details, click on the link ‘View in-app purchases’:

You should now see the ‘In-app purchases’ report:

The ‘In-app purchases’ report provides information about the purchases made through your mobile app(s).
You would need to set up mobile app tracking for the data to appear in your ‘In-app purchases’ report.
The second data card shows Publishers ad impressions by ad unit:

You would need to link your GA4 property with your Google Adsense account for this data to appear on your data card.
Once you have linked your GA4 property with your Google Adsense account and more than 24 hrs have elapsed, you could see the data on this data card:

For more details, click on the link ‘View publisher ads’:

You should now see the ‘Publisher ads’ report:

Through the ‘Publisher ads’ report, you can measure the performance of your ad units in terms of impressions, clicks, exposure and total ad revenue.
GA4 Ecommerce Purchases Report.
The Google Analytics 4 Ecommerce purchases report provides information about the products you sell on your website.

The top part of the ‘Ecommerce purchases’ report shows data trends for the items viewed by item name:

When you hover your mouse over an item name, you can see the data trend for that particular item:

The screenshot above shows the data trend for the item named ‘Google Campus Bike’.
Hover your mouse over the trend line to see more details:

Click on the forward arrow button to see data trend for other items:

The Bubble chart of the Ecommerce Purchases report
The top part of the ‘Ecommerce Purchases’ report also shows the bubble chart through which you can visualize the items viewed and items added to cart by Item name:

Hover your mouse over a bubble to see more details:

The data table of the ‘Ecommerce Purchase’ Report
The bottom part of the ‘Ecommerce Purchase’ Report contains a data table that provides information about the items viewed, items added to cart, items purchased and item revenue for each product sold on your website:

The ‘Item viewed’ metric.
The ‘Item viewed’ metric counts the total number of times an item was viewed by users.
You can populate values for this metric from the ‘items’ array in a ‘view_item’ event.
The ‘Items added to cart’ metric.
The ‘Items added to cart’ metric counts the total number of times an item was added to the shopping cart.
You can populate values for this metric from the ‘items’ array in an ‘add_to_cart’ event.
The ‘Items purchased’ metric.
The ‘Items purchased’ metric counts the total number of times an item was purchased.
You can populate values for this metric from the ‘items’ array in a ‘Purchase’ event.
The ‘Items revenue’ metric.
The ‘Items revenue’ metric counts the total revenue generated from selling a particular item.
The total revenue does not include tax and shipping charges.
The ‘Items revenue’ metric is calculated as item price x item quantity.
You can populate values for this metric from the ‘quantity’ and ‘price’ parameters in the ‘items’ array.
Use the search box if you want to see data for a particular item that you can’t see in the data table:

Let’s search for ‘dino socks’ item.
Type ‘dino socks in the search box and then press the enter key:

You can now see the data for the ‘dino socks’ item.
Click on the cross button next to the search term to see data for all the items:

By default, GA4 shows 10 rows of the data table.
If you want to see more than 10 rows, then click on the rows drop-down menu:

You can see up to 250 rows per page:


If you want to see more than 250 rows, then click on the forward arrow button >

You should now be able to see more than 250 rows of the data table:

Navigating to a particular row in the data table.
If you want to navigate to a particular row, say row number 400, then type this number in the text field next to ‘Go to:’.
Your data table will then starts from this row:

Click on the dimension drop-down menu to apply another primary dimension to your data table:

You should now see the list of all the primary dimensions available to you:

The ‘Item name’ dimension.
The ‘Item name’ dimension denotes the name of the product you sell on your website.
You can populate the value of this dimension from the item-level ‘item_name’ parameter in an ecommerce event.
The ‘Item ID’ dimension.
The ‘Item ID’ dimension denotes the ID that you specify for an item while setting up ecommerce tracking.
You can populate the value of this dimension from the item-level ‘item_id’ parameter in an ecommerce event.
The ‘Item Category’ dimension.
The ‘Item Category’ dimension denotes the first hierarchical category in which you classified an item while setting up ecommerce tracking.
For example, in Clothes/Men/Shirts/Summer/T-shirts, ‘Clothes’ is the item category.
You can populate the value of this dimension from the item-level ‘item_category’ parameter in an ecommerce event.
The ‘Item Category 2’ dimension.
The ‘Item Category 2’ dimension denotes the second hierarchical category in which you classified an item while setting up ecommerce tracking.
For example, in Clothes/Men/Shirts/Summer/T-shirts, ‘Men’ is the item category 2.
You can populate the value of this dimension from the item-level ‘item_category2’ parameter in an ecommerce event.
The ‘Item Category 3’ dimension.
The ‘Item Category 3’ dimension denotes the third hierarchical category in which you classified an item while setting up ecommerce tracking.
For example, in Clothes/Men/Shirts/Summer/T-shirts, ‘Shirts’ is the item category 3.
You can populate the value of this dimension from the item-level ‘item_category3’ parameter in an ecommerce event.
The ‘Item Category 4’ dimension.
The ‘Item Category 4’ dimension denotes the fourth hierarchical category in which you classified an item while setting up ecommerce tracking.
For example, in Clothes/Men/Shirts/Summer/T-shirts, ‘Summer’ is the item category 4.
You can populate the value of this dimension from the item-level ‘item_category4’ parameter in an ecommerce event.
The ‘Item brand’ dimension.
The ‘Item brand’ dimension denotes the brand of the item you sell.
You can populate the value of this dimension from the item-level ‘item_brand’ parameter in an ecommerce event.
Click on the primary dimension you want to apply to your data table.
Let’s click on ‘Item ID’ dimension.
You should now see a data table like the one below:

Click on the + button next to the primary dimension drop-down menu to apply a secondary dimension to your data table:

You should now see the categories of various dimensions that you can apply as a secondary dimension:

Let’s apply the ‘Country’ dimension:

Your data table is going to look like the one below:

To remove the secondary dimension from your report, click on the cross button next to it:

Note: The following metrics in the ‘Ecommerce purchases’ report did not begin to populate with data until September 8, 2022:
- Items viewed
- Items added to cart
If you hover your mouse over a metric in the data table, you will see an arrow next to it.
Click on the arrow to sort the data table in ascending or descending order:

You can further customise the ‘Ecommerce Purchase’ report by applying filters or comparisons to it:

GA4 In-app purchases Report.
The ‘In-app purchases’ report provides information about the products you sell through your mobile app.

The top part of the ‘In-app purchases’ report shows data trends for the total number of products sold (aka ‘Quantity’) by product ID:

When you hover your mouse over a product ID, you can see the data trend for that particular product ID:

The screenshot above shows the data trend for the product ID ‘extra_steps_pack_1’.
Hover your mouse over the trend line to see more details:

The Bar chart of the In-app Purchases report
The top part of the ‘In-app Purchases’ report also shows the bar chart through which you can visualize the total number of products sold by product ID:

Hover your mouse over a bar chart to see more details:

The data table of the In-app Purchase Report
The bottom part of the ‘In-app Purchase’ Report contains a data table that provides information about the quantity, product revenue and average product revenue for each product ID:

The ‘Product ID’ dimension.
The ‘Product ID’ dimension denotes the product code for in-app purchases in your mobile app.
This dimension is populated automatically by GA4 when you integrate your mobile app with Google Analytics.
The ‘Quantity’ metric.
The ‘Quantity’ metric measures the total number of products sold.
This metric is populated automatically by GA4 when you integrate your mobile app with Google Analytics.
The ‘Product Revenue’ metric.
The ‘Product Revenue’ metric is the sum of ‘In-App Revenue’, ‘Ecommerce Revenue’, ‘App Subscriptions’, and ‘Virtual Currency’ Spent.
The ‘Average Product Revenue’ metric.
The ‘Average Product Revenue’ metric is the average revenue for all products sold.
It is calculated as Product revenue / Quantity.
Use the search box if you want to see data for a particular product ID that you can’t see in the data table:

If you want to see more than 10 rows, then click on the rows drop-down menu:

Click on the + button next to the primary dimension drop-down menu to apply a secondary dimension to your data table:

You should now see the categories of various dimensions that you can apply as a secondary dimension to the in-app purchases report:

Click on the arrow to sort the data table of the in-app purchase report in ascending or descending order:

You can further customise the ‘In-app Purchases’ report by applying filters or comparisons to it:

GA4 Publisher Ads Report.
You can access your Google Adsense data in the ‘Publisher Ads’ report once you have linked your Adsense account with your GA4 property and more than 24 hrs have elapsed.

The top part of the ‘Publisher ads’ report shows data trends for the publisher ad impressions by ad unit:

When you hover your mouse over an ad unit, you can see the data trend for that particular ad unit:

The screenshot above shows the data trend for the ad unit named ‘floodit_unit_banner (30564961).
Hover your mouse over the trend line to see more details:

Click on the forward arrow button to see data trend for other ad units:

The Bar Chart of the Publisher ads report.
The top part of the ‘Publisher ads’ report also shows the bar chart through which you can visualize the publisher ad impressions by ad units:

Hover your mouse over a bar to see more details:

The data table of the Publisher ads Report
The bottom part of the ‘Publisher ads’ Report contains a data table that provides information about ad impressions, ad clicks, exposure and total ad revenue for each ad unit.

Ad unit – This dimension reports the name you chose for an ad unit. It uses the value of AdSense ad unit dimension.
Publisher ad impressions – This metric reports on Adsense impressions.
Ad unit exposure – This metric reports the time (measured in milliseconds) that a given ad unit was shown to a user.
Publisher ad clicks – This metric reports on Adsense clicks.
Total Ad revenue – This metric reports on the sum of all advertising revenue (i.e., AdSense revenue + other ad revenue).
Use the search box if you want to see data for a particular ad unit that you can’t see in the data table:

Click on the dimension drop-down menu to apply another primary dimension to your data table:

You should now see the list of all the primary dimensions available to you:

Page path and screen class dimension.
This dimension reports on the placement of Adsense Ad units:

Ad format dimension.
This dimension reports the format of an ad. It uses the value of AdSense ad format dimension:

Ad source dimension.
This dimension reports the name of the source network that served an ad. It uses the value of the AdSense publisher ID.

Click on the + button next to the primary dimension drop-down menu to apply a secondary dimension to your data table:

You should now see the categories of various dimensions that you can apply as a secondary dimension to your Publisher ads report:

Click on the arrow to sort the data table of the Publisher ads report in ascending or descending order:

You can further customise the ‘Publisher ads’ report by applying filters or comparisons to it:

GA4 Promotions Report.
Through the ‘Promotions’ report, you can determine the impact of each promotion on purchases and revenue.

In the context of GA4 ecommerce tracking, promotions refer to internal promotions on your website, where you advertise one part of your website or app from another part of your website or app via banners or popups.
The top part of the ‘Promotions’ report shows data trends for the items viewed in promotion by item promotion name:

When you hover your mouse over an item promotion name, you can see the data trend for that particular promotion:

The screenshot above shows the data trend for the promotion named ‘calling all youtube fans’.
Hover your mouse over the trend line to see more details:

Click on the forward arrow button to see data trend for other items:

The Bubble chart of the Promotions report
The top part of the ‘Promotions’ report also shows the bubble chart through which you can visualize the items viewed in promotion and items clicked in promotion by item promotion name:

Hover your mouse over a bubble to see more details:

The data table of the Promotions report.
The bottom part of the ‘Promotions’ Report contains a data table that provides information about the items viewed and clicked in promotions, item promotion CTR, items added to cart, items checked out and items purchased for each item promotion:

Item promotion name.
The ‘Item promotion name’ dimension denotes the name you specified for a promotion while setting up the ecommerce tracking.
Items viewed in promotion.
The ‘Items viewed in promotion’ metric counts the number of items viewed in a promotion.
You can populate this metric by sending an ‘items’ array with the ‘view_promotion’ event.
Items clicked in promotion.
The ‘Items clicked in promotion’ metric counts the number of items clicked in a promotion.
You can populate this metric by sending an ‘items’ array with the ‘select_promotion’ event.
Item promotion click through rate.
The ‘Item promotion click through rate’ metric is calculated as the number of users who selected a promotion(s) divided by the number of users who viewed the same promotion(s).
You can populate this metric by sending an ‘items’ array with the ‘select_promotion’ and ‘view_promotion’ events.
Items added to cart.
The ‘Items added to cart’ metric counts the number of items that were added to a shopping cart.
You can populate this metric by sending an ‘items’ array with the ‘add_to_cart’ event.
Items checked out.
The ‘Items checked out’ metric counts the number of items that were in the shopping cart during checkout.
You can populate this metric by sending an ‘items’ array with the ‘begin_checkout’ event.
Items purchased.
The ‘Items purchased’ metric counts the number of items that were purchased.
You can populate this metric by sending an ‘items’ array with the ‘purchase’ event.
Use the search box if you want to see data for a particular item promotion that you can’t see in the data table:

If you want to see more than 10 rows, then click on the rows drop-down menu:

You can see up to 250 rows per page:

If you want to see more than 250 rows, then click on the forward arrow button >

Navigating to a particular row in the data table.
If you want to navigate to a particular row, say row number 25, then type this number in the text field next to ‘Go to:’.
Your data table will then starts from this row:

Click on the dimension drop-down menu to apply another primary dimension to your data table in the Promotions report:

You should now see the list of all the primary dimensions available to you:

Item promotion ID.
The ‘Item promotion ID’ dimension denotes the ID you specified for a promotion while setting up the ecommerce tracking.
Item promotion creative name.
The ‘Item promotion creative name’ dimension denotes the name you specified for the creative associated with the promotion while setting up the ecommerce tracking.
Click on the + button next to the primary dimension drop-down menu to apply a secondary dimension to your data table:

You should now see the categories of various dimensions that you can apply as a secondary dimension:

Note: The following metrics in the ‘Promotions’ report did not begin to populate with data until September 8, 2022:
- Items viewed in promotion.
- Items clicked in promotion.
- Items added to cart.
- Items checked out.
Click on the arrow to sort the data table of the Promotions report in ascending or descending order:

You can further customise the ‘Promotions’ report by applying filters or comparisons to it:

GA4 Purchase Journey Report.
The Purchase Journey Report provides insights into the number of users who abandon the purchase process at each stage of your sales funnel.

This report is instrumental in pinpointing areas within the funnel that require improvement.
For example,
If users frequently drop off between initiating the checkout process and completing the purchase, it would be beneficial to investigate potential issues such as sudden and expensive shipping costs or non-functional buttons or links.
The top part of the ‘Purchase Journey’ report visualizes the users’ journey to purchase:

Following is a brief description of each step shown in the funnel visualization:
Step-1: Session start – This step shows the number of users who started a GA4 session on your website (i.e. triggered the ‘session_start’ event).
Step-2: View product – This step shows the number of users who viewed a product on your website (i.e. triggered the ‘view_item’ event).
Step-3: Add to cart – This step shows the number of users who added items to their shopping cart (i.e. triggered the ‘add_to_cart’ event).
Step-4: Begin Checkout – This step shows the number of users who initiated checkout on your website (i.e. triggered the ‘begin_checkout’ event).
Step-5: Purchase – This step shows the number of users who made a purchase on your website (i.e. triggered the ‘purchase’ or ‘in_app_purchase’ event).
The bottom part of the funnel visualization shows the abandonment rate at each step of the purchase funnel:

From the screenshot above, we can conclude that 43,000 users abandoned the purchase funnel at step-1, 12,000 users abandoned the funnel at step-2 and so on.
If you want to know how many users out of all the users abandoned the purchase funnel at a particular step, then hover your mouse over the bar that corresponds to a particular step:

From the screenshot above, we can conclude that 43,000 users out of 59,000 total users abandoned the purchase funnel at step-1.
The abandonment rate was 73.3%
Pay close attention to the word ‘Close Funnel’ at the top of the visualization:

By default, the ‘Purchase Journey’ report employs a closed funnel approach, which means it only includes data for users who successfully navigate through each step of the purchase funnel.
Users are only tallied in the specific steps they complete in the designated order.
If a user skips a step, they are considered to have exited the funnel and are not included in the subsequent steps’ count.
Suppose a user skips any of these steps or enters the funnel at a midpoint (such as ‘Begin Checkout’).
In that case, they are not included in the funnel analysis.
So, users who skip the initial steps (like viewing products or adding items to the cart) and jump straight to checkout won’t be included, even if they complete the purchase.
This provides an incomplete picture of the overall purchase journey, making the purchase journey report not very reliable.
Is the purchase journey report not showing the data?
If you are using a closed funnel in GA4, make sure that you are tracking each step of the funnel. Otherwise, your report won’t produce accurate visualization.

For example, both ‘Purchase Journey’ and ‘Checkout Journey’ monetization reports employ a closed funnel approach by default, which means it only includes data for users who successfully navigate through each step of the purchase funnel.
Users are only tallied in the specific steps they complete in the designated order.
If a user skips a step, they are considered to have exited the funnel and are not included in the subsequent steps’ count.
Similarly, if you skip tracking a particular step, it is equivalent to users skipping a step.
So, they are considered to have exited the funnel and are not included in the subsequent steps’ count.
Since the purchase journey report is a closed funnel, it is useful for data analysis as a closed funnel only when you are tracking all of the following events: ‘session_start’, ‘view_item’, ‘add_to_cart’, ‘begin_checkout’, ‘purchase’ (or ‘in_app_purchase’) events.
If you are not tracking any or all of these events, then you won’t see accurate data in the purchase journey report.
For example, if you are tracking ‘session_start’ but not ‘view_item’ event, then you may not see any progression in your user purchase journey report after ‘Session Start’ even when you are tracking all other relevant events (‘add_to_cart’, ‘begin_checkout’ and ‘purchase’ events).
Remember, if you skip tracking a particular step in a closed funnel, it is equivalent to users skipping a step.
Make the Purchase Journey report an open funnel.
In order to benefit from the purchase journey report make it an open funnel by using the toggle button:

This funnel would track all users who follow any steps.
Even users who skip any of these steps or enter mid-funnel are included in the funnel analysis.
Thus, with open funnels, you get a more comprehensive view of the user purchase journey.
Click on the link ‘View funnel steps’ to open a read-only view of the steps that make up the purchase funnel:

You should now see a screen like the one below:

Note: The ‘Purchase Journey’ report does not allow for customisation of the funnel. However, you can create a custom funnel report if you wish to examine a different funnel.
Click on the + or – buttons to zoom in and out of the bar chart:

Zooming in (by clicking on the + button) increases the size of each bar so that you can see smaller bars in more detail:

Note: If you see a curve added to a bar, it means the bar is not drawn to scale (i.e. the height of the bar is greater than the graph’s height).
The data table of the Purchase Journey.
The bottom part of the ‘Purchase Journey’ report contains a data table which provides information for each step in the purchase funnel for each device category:

Click on the dimensions drop-down menu to see the list of all the dimensions available for the Purchase Journey report:


Click on the arrow to sort the data table of the Purchase Journey report in ascending or descending order:

You can further customise the ‘Purchase Journey’ report by applying filters or comparisons to it:

Create and use your own purchase journey report
Create and use your own purchase journey report instead of the one provided by GA4, as users’ purchase journey can vary from website to website.
While GA4 offers a default purchase journey report, every website/business can have unique user journeys.
Creating a custom report tailored to your specific user journey can provide tailored insights.
Understand the specific stages your users typically go through before purchasing by browsing the website and asking questions from your client.
Identify and track the events that correspond to each stage of your journey.
Then, use the exploration report template (or Looker studio report) to create your own unique purchase journey report.
Create user segments in GA4 for users who reach different stages of the journey. This way, you can analyze and target these segments differently.
For example, you might want to retarget users who added a product to their cart but did not complete a purchase.
If you have important data outside of GA4 (like a phone call) that influences the purchase journey, consider integrating it.
You can do this via phone call tracking software, GA4 Data Import feature or use tools like BigQuery to combine datasets for more complex data analysis.
As your website evolves, the user journey might change.
So, it’s good practice to periodically review and adjust your custom purchase journey report to ensure it stays relevant.
All of this is not possible if you continue to rely on the default reports provided by GA4.
Rookies rely on defaults, while pros customized everything. Be a pro.
GA4 Order Coupon Report.
The ‘Order Coupons’ report shows the revenue associated with each coupon on your website or app.

You can access this report only through the ‘Monetization Overview’ report.
How to access the Order Coupon Report?
To access the ‘Order Coupon’ report, follow the steps below:
Step-1: Navigate to the ‘Monetization Overview’ report:

Step-2: Scroll down the report until you see the data card named ‘Purchase revenue by Order coupon’:

Step-3: Click on the link ‘View order coupons’ to see the ‘Order Coupon’ report:

The top part of the ‘Order Coupon’ report shows data trends for purchase revenue by order coupon:

When you hover your mouse over an order coupon name, you can see the data trend for that particular coupon:

Hover your mouse over the trend line to see more details:

The Bar Chart of the Order Coupon Report.
The top part of the ‘Order Coupon’ report also shows the bar chart through which you can visualize purchase revenue by order coupon:

The data table of the Order Coupon Report.
The bottom part of the ‘Order Coupon’ report contains a data table that provides information about purchase revenue, ecommerce purchase quantity and ecommerce revenue associated with each order coupon:

The ‘Order Coupon’ dimension denotes the coupon name or code that you specified for discounted items while setting up ecommerce tracking.
Google recommends that you pass values to the ‘Order Coupon’ dimension by sending the event-level ‘coupon’ parameter with an online-sales event.
If you do not populate the ‘Order Coupon dimension’ while setting up ecommerce tracking, GA4 will report (not set) as the value of the ‘Order Coupon dimension’:

Purchase revenue.
This metric is calculated as purchases + in-app purchases + subscriptions – refund
Technically speaking, the ‘Purchase revenue’ metric is the sum of the following events: ‘purchase’, ‘in_app_purchase’, ‘app_store_subscription_renew’, and ‘app_store_subscription_convert’ minus the ‘refund’ events.
Ecommerce purchase quantity.
This metric counts the number of units for a ‘purchase’ event.
Click on the dimension drop-down menu to apply another primary dimension to your data table:

You should now see the list of all the primary dimensions available to you:

Click on the + button next to the primary dimension drop-down menu to apply a secondary dimension to your data table:

Click on the arrow to sort the data table of the Order Coupon report in ascending or descending order:

You can further customise the ‘Order Coupon’ report by applying filters or comparisons to it:

GA4 Checkout Journey Report.
According to Statista, the average online shopping cart abandonment rate is 74.1%.
That means that out of every 100 potential clients, 74 may abandon your shopping cart today.
Now, calculate how much money you are losing each day in terms of lost potential sales.
This abandonment can be minimized if you direct your efforts towards optimizing your checkout process.
In GA4, you can optimize your checkout process through the Checkout Journey report.
Through the Checkout Journey report in GA4, you can determine how users moved from one step of your checkout funnel to the next and at which step they entered or exited the checkout funnel.
To view this report, follow the steps below:
Step-1: Login to your GA4 property and then click on the ‘Reports’ menu:
 2")
Step-2: Navigate to the ‘Checkout Journey’ report under ‘Monetization’:
 3")
You should now see a report like the one below:
 4")
From the ‘Checkout Journey’ report above, we can conclude that only 22% of users moved from the ‘Begin checkout’ stage to the ‘Add shipping’ stage. The remaining 78% of users dropped off the checkout funnel.
If we could increase the number of users that moved from the ‘Begin checkout’ stage to the ‘Add shipping’ stage, we could increase the probability of generating more sales on the website.
Now, the problem is we don’t know exactly which users proceeded to the ‘Add shipping ’ page from the ‘Begin checkout’ page and which didn’t.
We don’t know how the users arrived on the website and why they abandoned the checkout.
We have got a lot of questions to ask:
- Were they the users from organic search?
- Were they the users from paid search?
- Were they the users from social media?
- Did they use a desktop, tablet or mobile device to visit the website?
- Why did they visit the website?
- Why did they abandon the checkout?
Without segmenting the checkout funnel, you won’t be able to understand the reason for the drop-off from one checkout step to the next and how that drop-off can be reduced or eliminated.
You can segment the checkout funnel by using the comparison feature:
 5")
Segment your checkout funnel by using the following custom segments:
- Organic search traffic
- Tablet and desktop traffic
- Paid search traffic
- Social media traffic
- Direct traffic
- Site search traffic
- Referral traffic
- Email traffic
- Mobile traffic
- Products
- Product categories
Following is an example of a checkout funnel segmented by ‘Organic Search Traffic’:
 6")
You can also determine the reason for drop-offs from one checkout step to the next through ‘voice of customers’ analysis tools like:
- Heat map analysis.
- Session recordings.
- Usability testing.
- Online and offline surveys.
- A/B testing.
- Online and offline market research, etc.
The following could be the technical reasons for drop-offs from one checkout step to the next:
- Website errors (especially slow-loading pages).
- Data collection issues.
- Data integration issues.
- Cross-browser compatibility issues.
- Cross-device compatibility issues.
The Checkout Journey Report displays both the count and percentage of users who initiated the checkout process on your website/app and navigated through each of the subsequent steps in the checkout funnel.
 7")
Use the ‘Checkout Journey’ report to determine the biggest drop-offs from one step of the checkout funnel to the next.
These drop-offs can help to explain which part of the checkout funnel needs urgent attention.
For example, suppose there’s a significant decline in user activity between the “Begin Checkout” and “Add Shipping” stages:
 8")
In that case, you should investigate potential problems in the shipping phase, like hidden shipping fees.
Important points about the Checkout Journey report in GA4.
#1 You will be able to use the ‘Checkout Journey’ report in GA4 only when you have set up ecommerce tracking in your GA4 property.
#2 To see data in the report, you must implement the following ecommerce events: ‘begin_checkout‘, ‘add_shipping_info‘, ‘add_payment_info‘ and ‘purchase‘.
#3 The ‘Checkout Journey’ report employs a closed funnel approach, which means it only includes data for users who successfully navigate through each step of the purchase funnel.
 9")
The users are only tallied in the specific steps they complete in the designated order.
If a user skips a step, they are considered to have exited the funnel and are not included in the subsequent steps’ count.
Checkout Behavior Analysis report not showing the data?
If you are using a closed funnel in GA4, make sure that you are tracking each step of the funnel. Otherwise, your report won’t produce accurate visualization.
For example, the ‘Checkout Journey’ monetization report employ a closed funnel approach, which means it only includes data for users who successfully navigate through each step of the checkout funnel.
If a user skips a step, they are considered to have exited the checkout funnel and are not included in the subsequent steps’ count.
Similarly, if you skip tracking a particular step, it is equivalent to users skipping a step.
 10")
So, they are considered to have exited the checkout funnel and are not included in the subsequent steps’ count.
For example, if you are tracking ‘begin_checkout’ and ‘purchase’ events but not ‘add_shipping’ and ‘add_payment’ events, then you may not see any progression in your ‘Checkout Journey’ after ‘begin_checkout’.
Remember, if you skip tracking a particular step in a closed funnel, it is equivalent to users skipping a step.
Click on the link ‘View funnel steps’ to open a read-only view of the steps that make up the checkout funnel:
 11")
 12")
Note: The ‘Checkout Journey’ report does not allow for customisation of the funnel. However, you can create a custom funnel report if you wish to examine a different funnel.
The data table of the Checkout Journey Report.
The bottom part of the ‘Checkout Journey’ report contains a data table which provides information for each step in the checkout funnel for each device category:
 13")
Other Articles on GA4.
- Tracking New, Qualified and Converted Leads in GA4.
- Free GA4 training and tutorial with Certification.
- Understanding GA4 Ecommerce Reports (Monetization Reports).
- GA4 Ecommerce Tracking via GTM: Step-by-Step Setup Guide.
- How to see UTM parameters in GA4 (Google Analytics 4).
- GA4 UTM parameters not working? Here is how to fix it.
- How To Use UTM parameters in GA4 (Campaign Tracking).
- How to track AI traffic in GA4.
- Understanding Google Analytics 4 cookies – _ga cookie.
- GA4 (Google Analytics 4) Measurement Protocol Tutorial.
- GA4 Unassigned Traffic: Causes and How to Fix it Fast.
- GA4 Regex (Regular Expressions) Tutorial.
- GA4 Direct Traffic Spike: Common Causes and How to Fix Them.
- gtag.js – Google Tag in Google Analytics 4 and beyond.
- GA4 Scopes – User, Session, Event & Item scopes.
- GA4 Conversion Tracking (Key Events) Tutorial.
- GA4 (not set) - Guide to fixing (not set) issue.
- GA4 Certification Exam: Questions, Answers for Skillshop (GAIQ).