

Running a voice AI operation without monitoring is like driving at night with your headlights off. Everything might be fine until it suddenly is not.
Retell AI's alerting feature solves this problem by continuously monitoring your key metrics and notifying you the moment something goes wrong.
Instead of manually checking dashboards throughout the day, you get automatic notifications delivered straight to your email or via a webhook.
This article walks you through everything you need to know about setting up and using alerts in Retell AI.
What Alerting does and why it matters.
Alerting lets you create rules to monitor specific metrics for your voice AI calls. When a metric crosses a threshold you have defined, the system sends you a notification.
Think of it as a security guard for your voice AI operations that never takes a break.
For example,
Imagine you run a real estate agency with a voice AI agent handling inbound enquiries.
On a normal day, you receive around 50 calls.
If that number suddenly drops to 5, something is clearly wrong; perhaps a phone number has been disconnected, or an API key has expired.
Without alerting, you might not notice for hours or even days. With alerting, you would know within minutes.
Here are some practical scenarios where alerting proves valuable.
- You can monitor call volume to catch unexpected spikes or drops.
- You can track system health by watching for increases in API errors or function failures.
- You can set budget alerts so that call costs never exceed a specific amount without your knowledge.
- And you can detect quality issues by watching for declining success rates or rising negative sentiment.
The metrics you should monitor.
Retell AI gives you access to nine different metrics that cover volume, performance, cost, and quality.
- Call Count.
- Concurrency Used.
- Call Success Rate.
- Negative Sentiment Rate.
- Custom Function Latency.
- Custom Function Failure Count.
- Transfer Call Failure Count.
- Total Call Cost.
- API Error Count.
#1 Call Count.
Call Count tracks the total number of calls within your chosen time window.
This is your most basic volume indicator.
If you normally handle 200 calls per day and that number drops to 20, you want to know immediately.
#2 Concurrency Used.
Concurrency Used shows the peak number of calls happening at the same time.
This is important if you have concurrency limits on your plan.
For instance, if your plan supports 20 concurrent calls and you are regularly hitting 19, you are dangerously close to turning callers away.
#3 Call Success Rate.
Call Success Rate measures the percentage of calls that complete successfully, expressed as a value between 0 and 100.
A sudden drop from 95% to 60% could indicate a problem with your agent's configuration or a third-party integration issue.
#4 Negative Sentiment Rate.
Negative Sentiment Rate tracks the percentage of calls where the caller expressed negative sentiment.
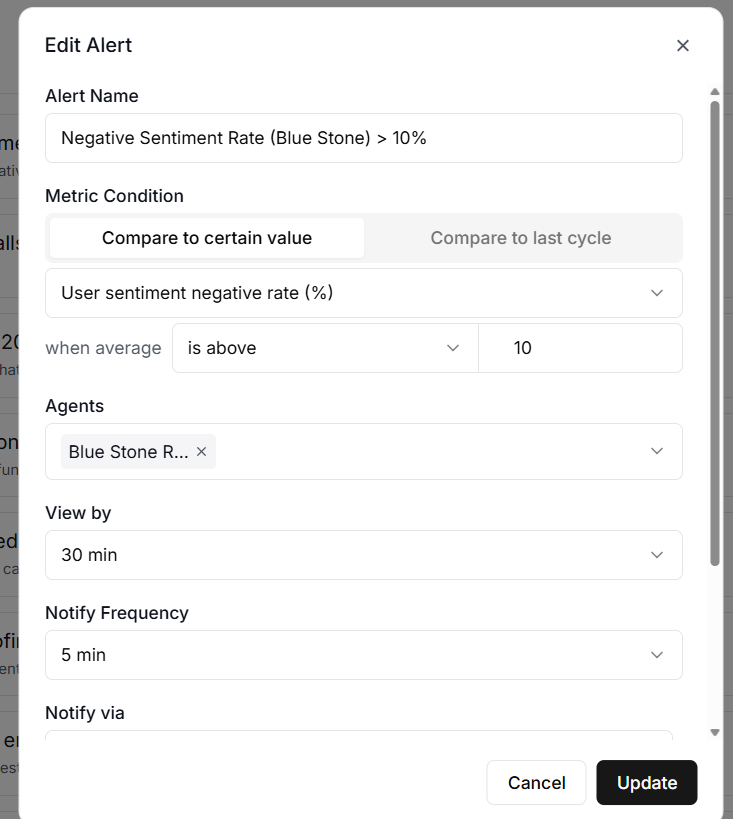
If this number starts climbing, it might mean your agent's responses need tuning or that a recent prompt change has introduced problems.
For an outbound voice agent, a sharp increase in the negative sentiment rate could indicate that your targeting and/or offering require adjustments.
#5 Custom Function Latency.
Custom Function Latency measures the average time it takes your custom functions to respond, in milliseconds.
If your agent calls an external API to look up appointment availability and that API starts responding slowly, your callers will notice.
An alert on this metric helps you catch the problem before it ruins too many conversations.
#6 Custom Function Failure Count.
Custom Function Failure Count counts how many times your custom functions have failed.
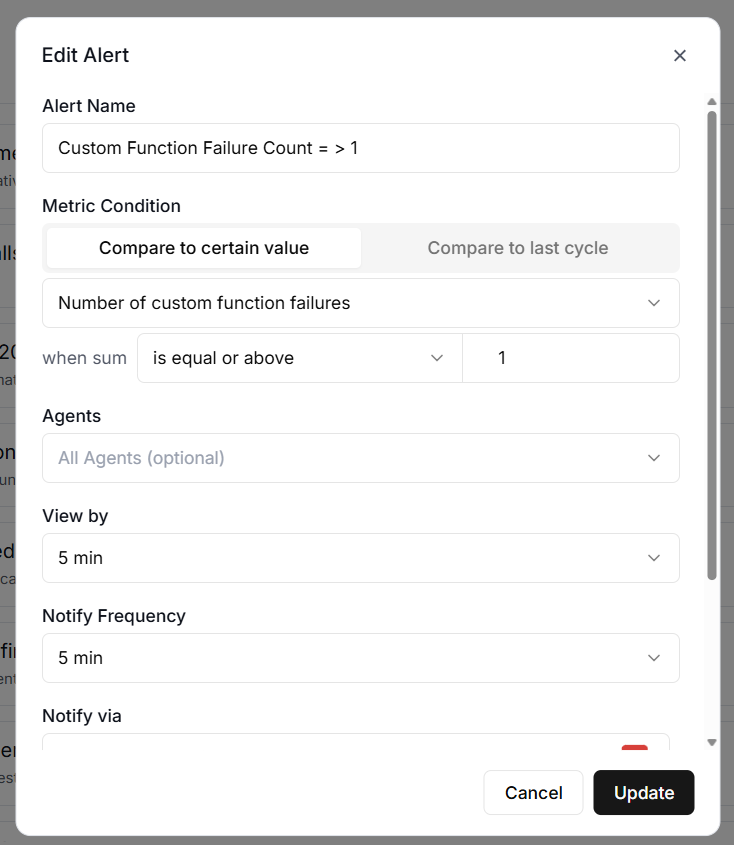
Even a handful of failures can mean missed bookings, lost data, or confused callers.
#7 Transfer Call Failure Count.
The Transfer Call Failure Count tracks failed call transfers.
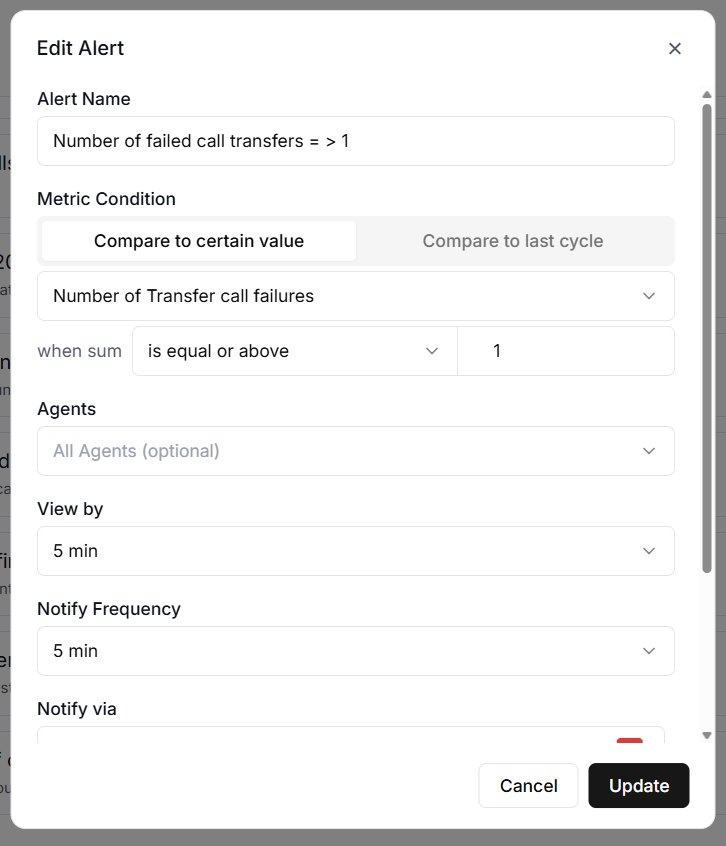
If your agent is supposed to transfer high-value leads to a human agent and those transfers are failing, you are losing money with every failed attempt.
#8 Total Call Cost.
Total Call Cost monitors the total cost of calls in US dollars. This is essential for budget management.
If you set a daily budget of $50 and an unexpected spike pushes costs toward $200, you want to know before it happens, not after.
#9 API Error Count.
API Error Count counts the number of API errors and can be filtered by specific error codes.
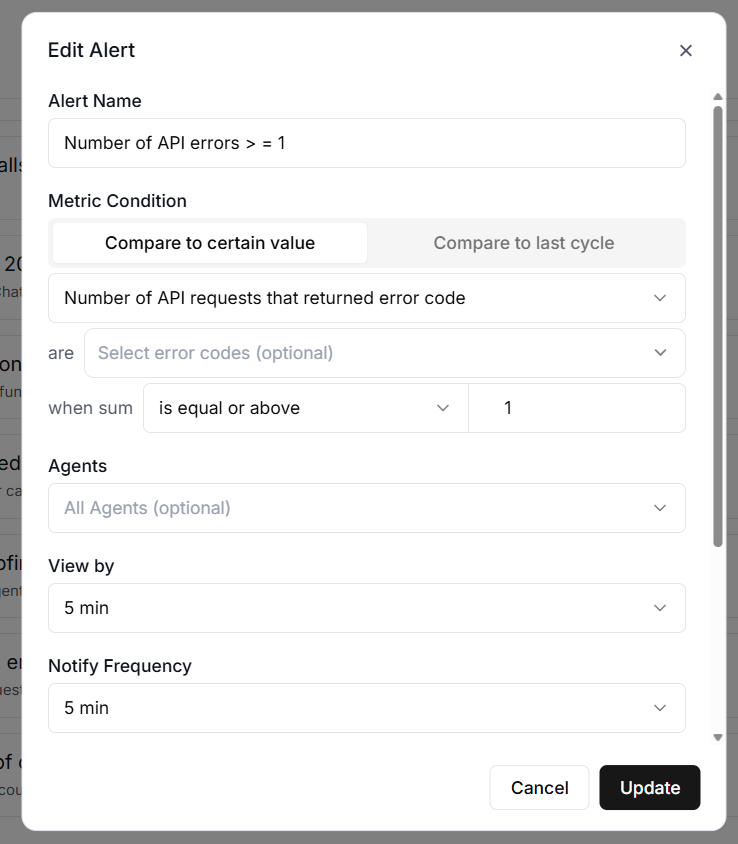
For example, you might want to alert specifically on 429 errors, which indicate you are being rate-limited, or 402 errors, which indicate a payment issue.
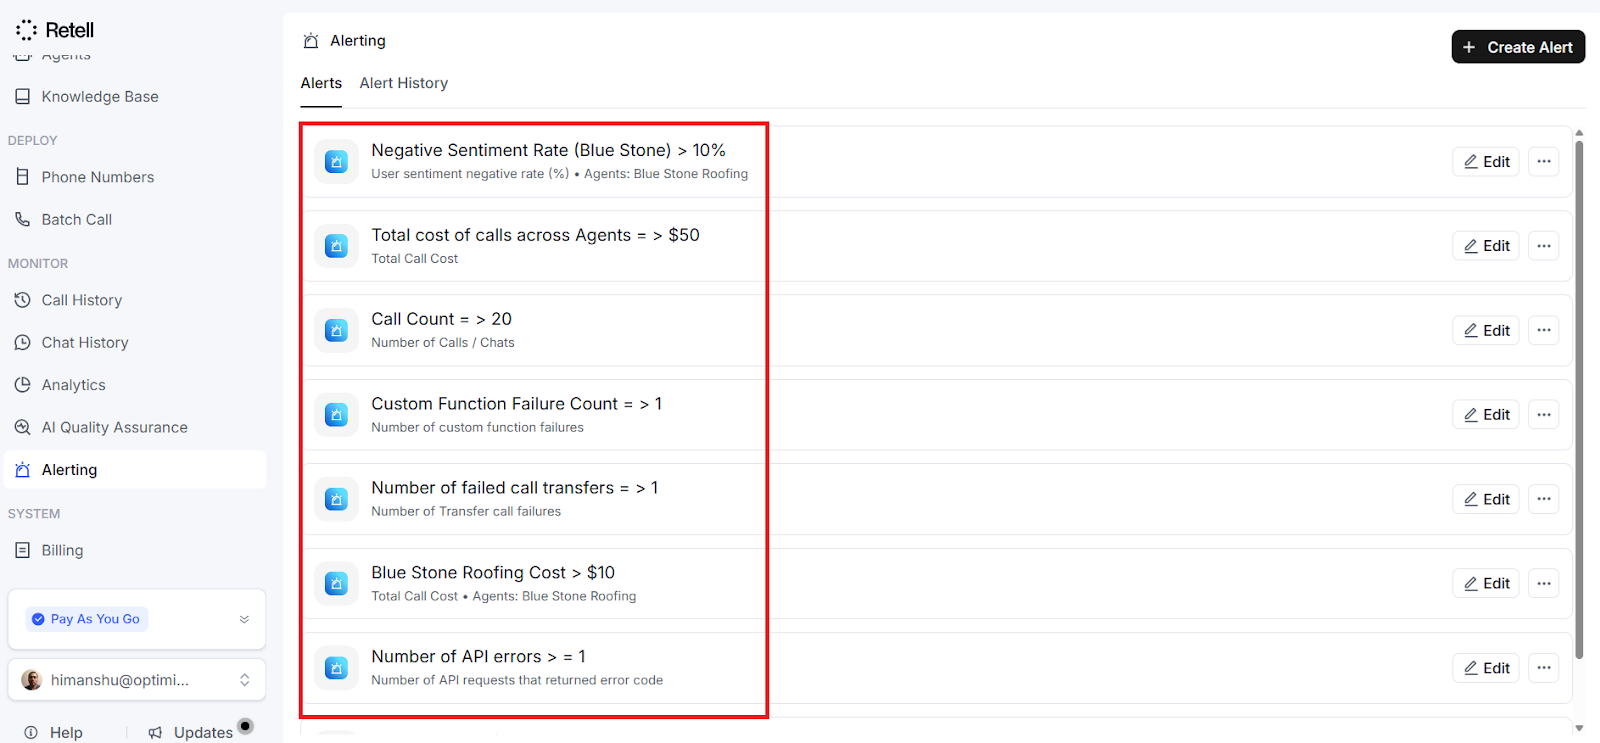
How to Create an Alert Rule in Retell AI.
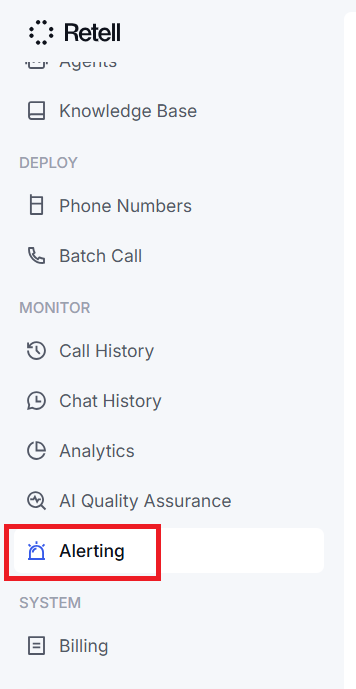
You create alert rules from the Alerting tab in your Retell AI dashboard.
Click on the ‘Create Alert’ button located at the top right-hand side of your screen:
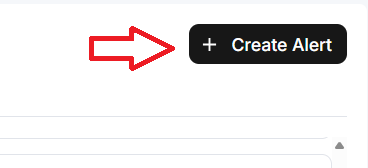
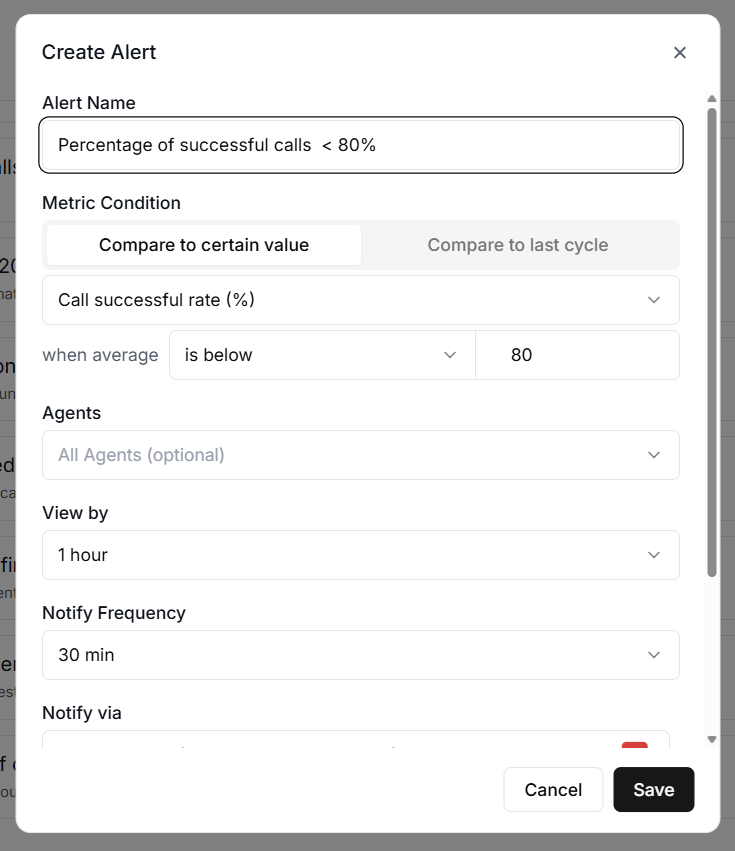
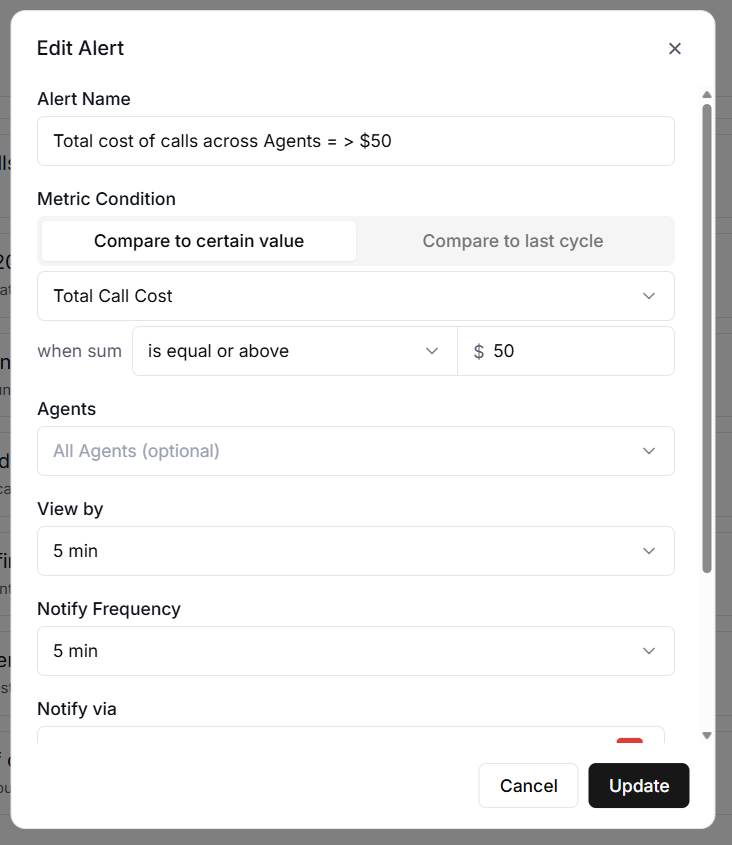
You will now see the ‘Create Alert’ dialogue box:
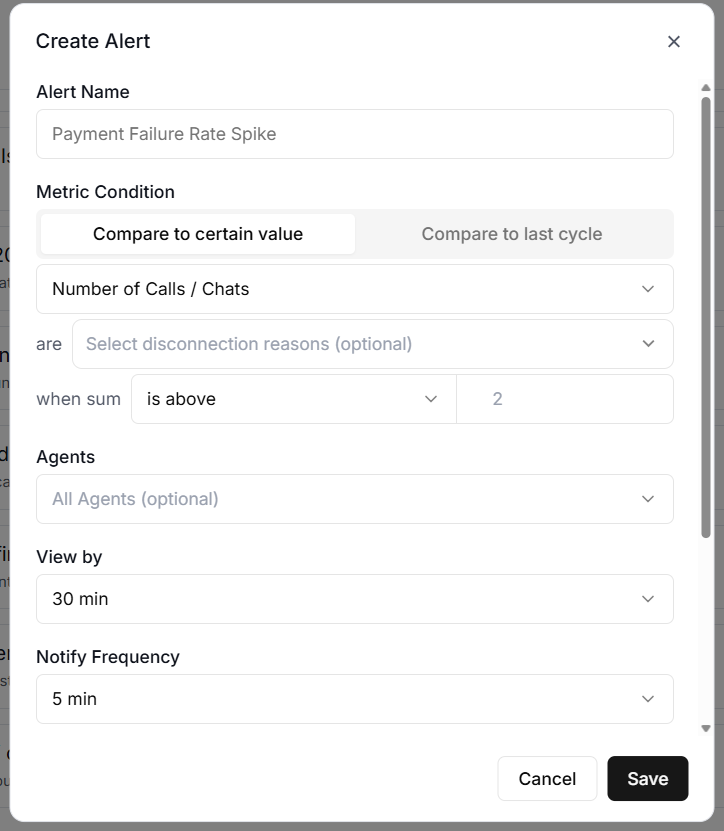
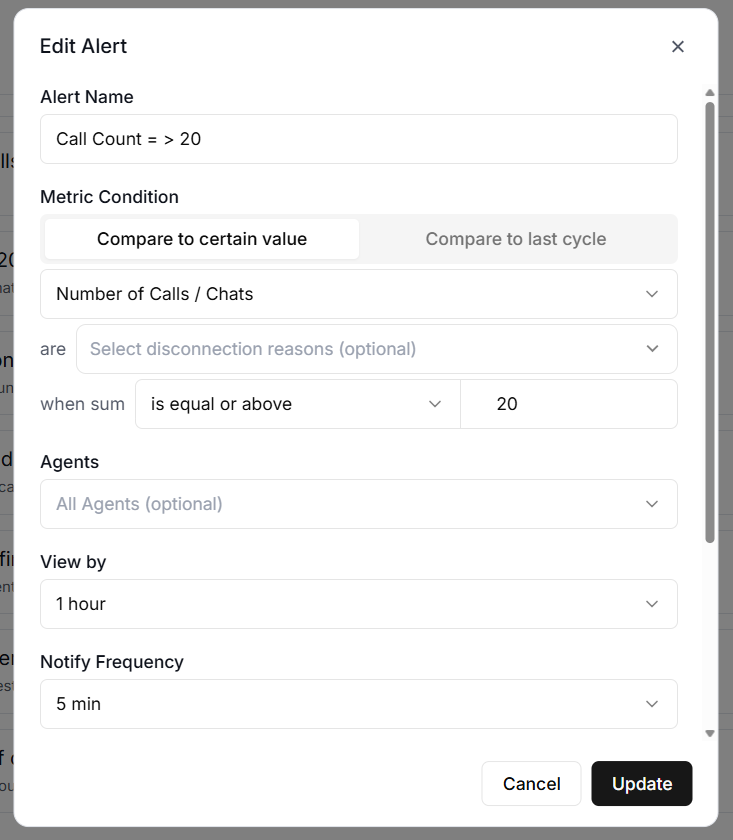
Each Alert rule needs several pieces of information.
#1 Alert Name.
A descriptive name for the alert. Something like "Daily Cost Exceeds $100" is far more useful than "Alert 1" when you are trying to figure out which notification just landed in your inbox at 11 pm.
#2 Metric Condition.
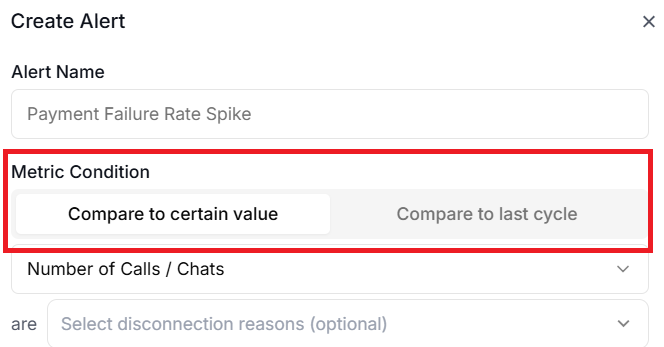
Use ‘Metric Condition’ to select the threshold type.
You can select Compare to Certain Value (absolute threshold) or Compare to last cycle (relative threshold).
If you don’t have any historical performance data, use Compare to Certain Value.
‘Compare to Certain Value’ compares the current metric value directly against a fixed number.
This is straightforward and works well when you have a clear line in the sand.
For example, you might set an alert for when ‘Call Count’ is greater than 500 in the last hour.
Every time the system checks, it simply asks whether the call count exceeded 500. If yes, the alert fires.
‘Compare to last cycle’ compares the percentage change from one period to the next. This is more useful for detecting sudden changes rather than fixed limits.
For example, you might set an alert for when the ‘Call Count’ increases by more than 50% compared to the previous period.
The system calculates this using the formula: current value minus previous value, divided by previous value, multiplied by 100.
So if you had 100 calls in the previous hour and 160 in the current hour, that is a 60% increase, which would trigger the alert.
One thing to be aware of with relative thresholds is how they handle zero values.
If the previous period had no calls at all, but the current period does, the system treats this as an infinite increase.
Any alert using a greater-than or greater-than-or-equal comparator will trigger in this situation.
#3 Metric drop-down menu.
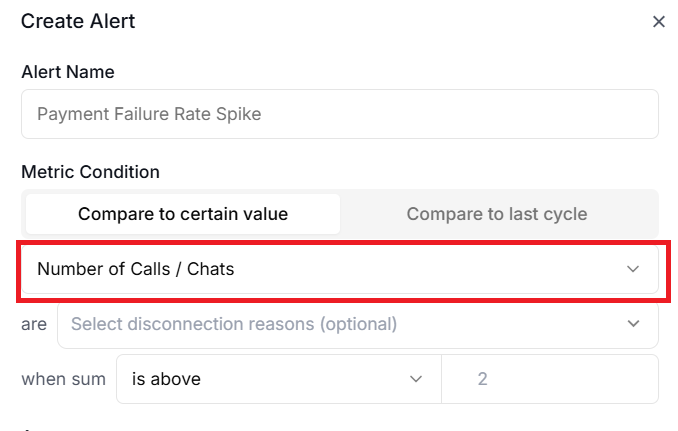
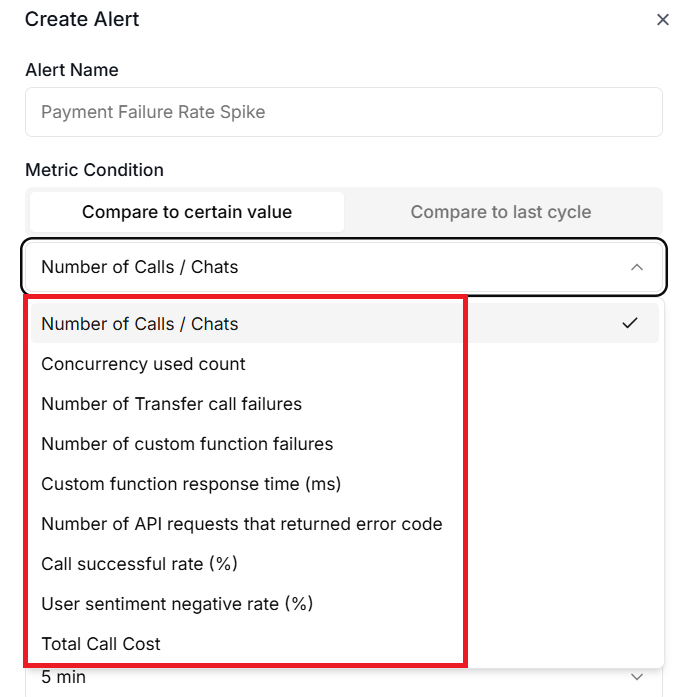
Select the metric to monitor.
#4 The disconnection reason filter.
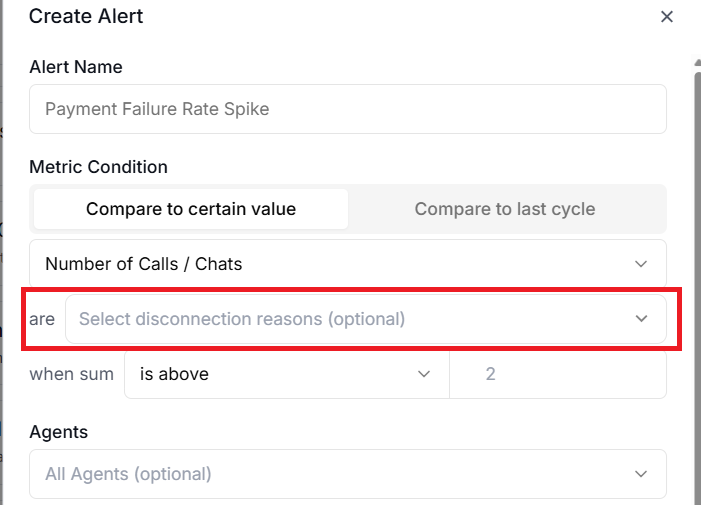
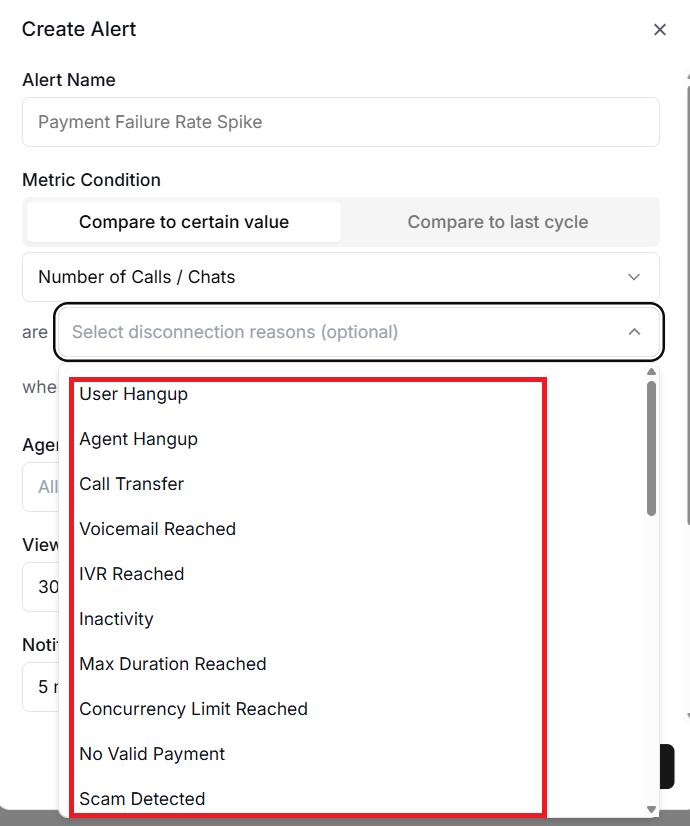
The disconnection reason filter lets you focus on calls that ended for specific reasons, such as user hangups or agent hangups.
For example, if you only care about calls that ended due to errors rather than normal hangups, this filter keeps your alerts relevant.
The error code filter applies specifically to the ‘API Error Count’ metric and lets you watch for particular HTTP status codes.
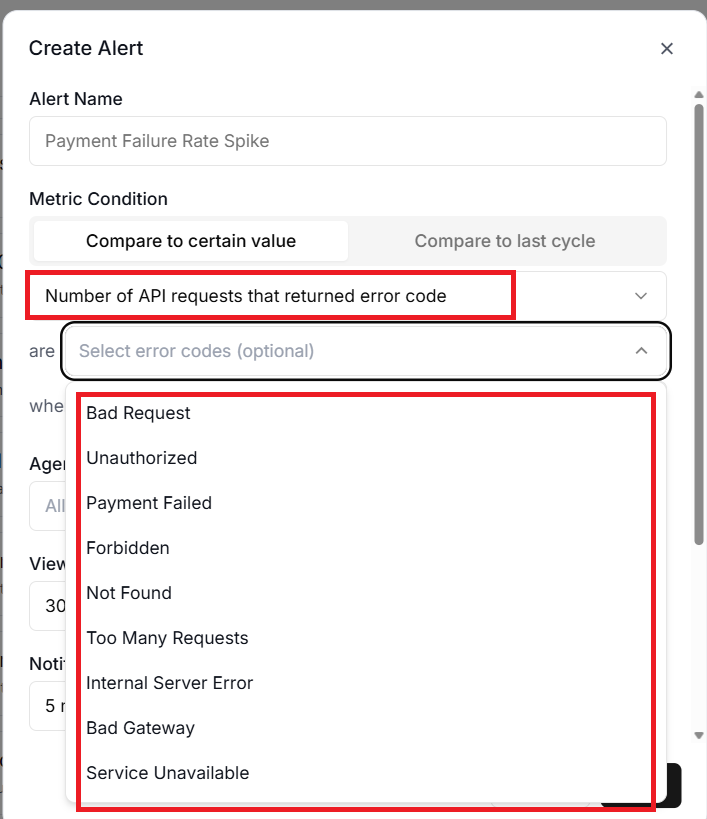
Monitoring 429 errors separately from 500 errors makes sense because they indicate completely different problems, rate limiting versus server failures, and require different responses.
#5 when sum.
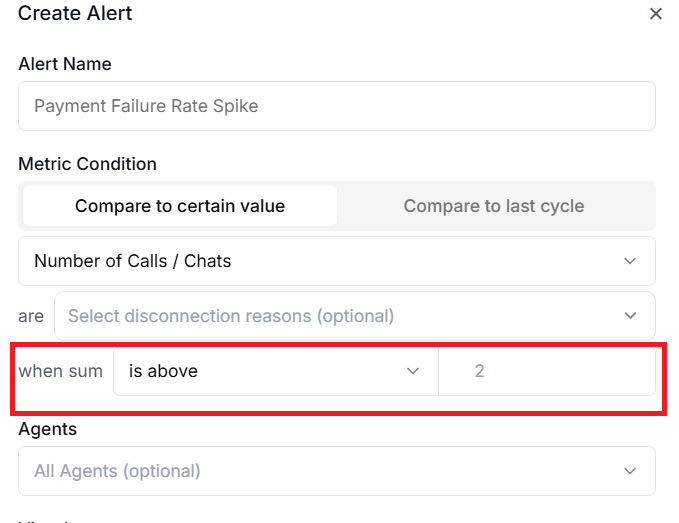
Use this filter to narrow down exactly what an alert watches.
#6 The agent filter.
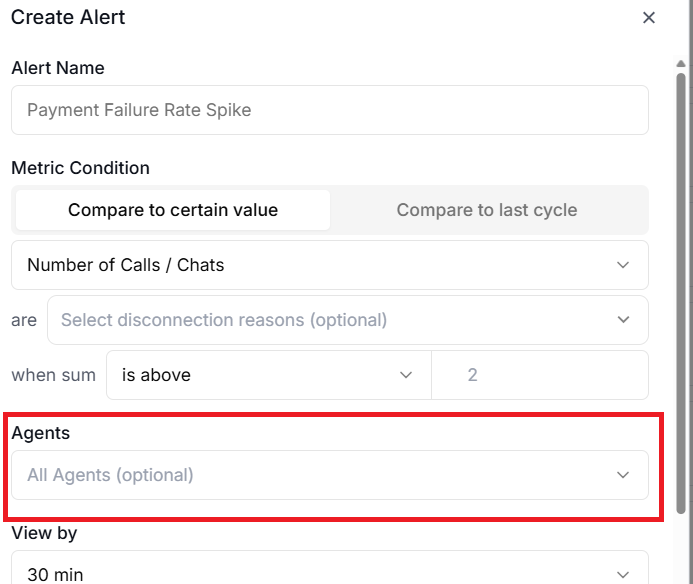
The agent filter lets you monitor specific agents rather than your entire account.
You can select multiple agents in the filter configuration, and the metric will be calculated across all selected agents.
You can also filter by agent version. This is particularly useful after deploying a new version of an agent.
You could set an alert to watch only the new version's success rate so you catch regressions quickly.
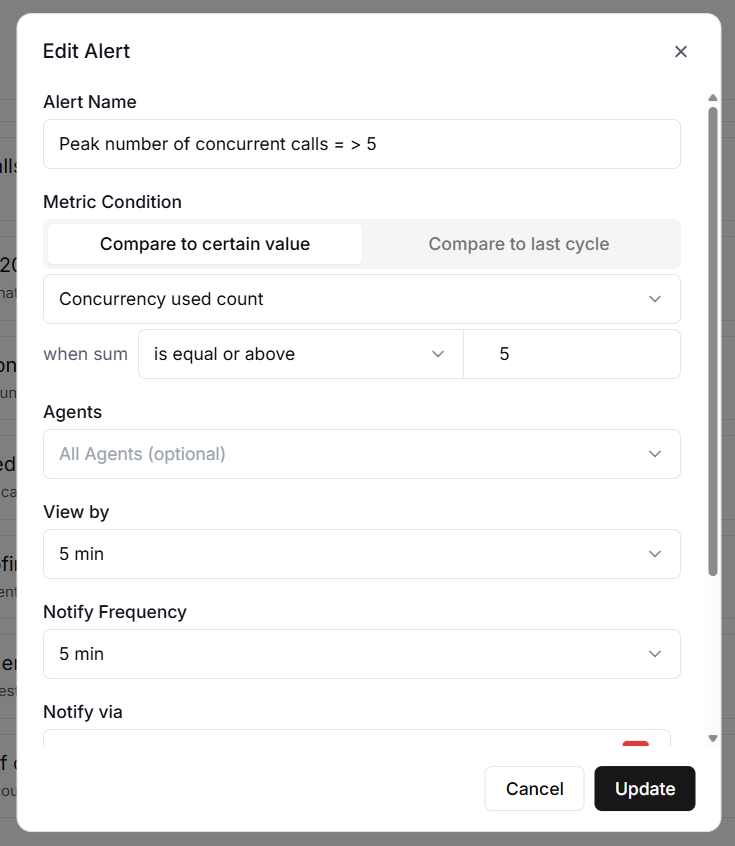
#7 View by.
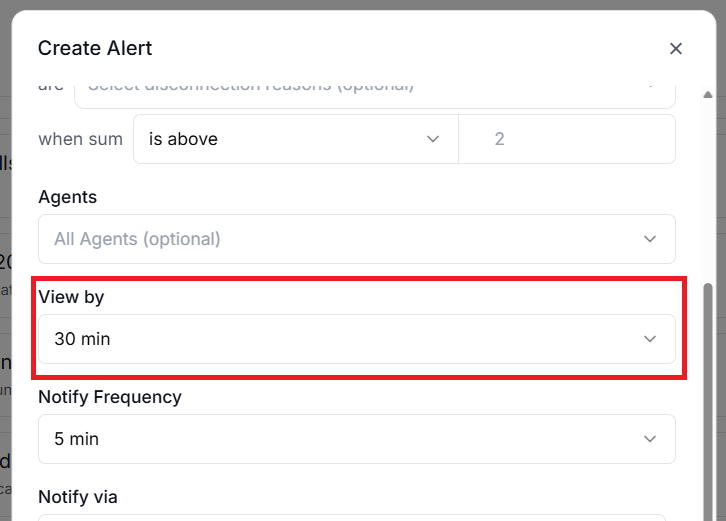
‘View by’ denotes the evaluation window. The evaluation window is how far back the system looks when calculating the metric.
#8 Notify Frequency.
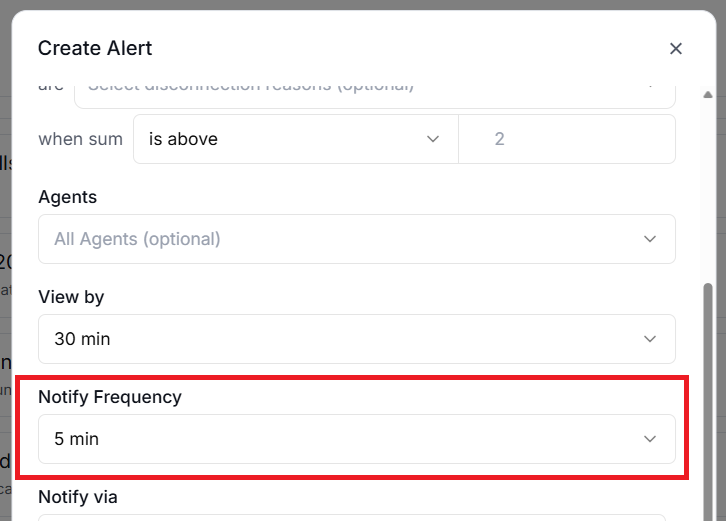
Notify frequency is how often the system evaluates the alert rule.
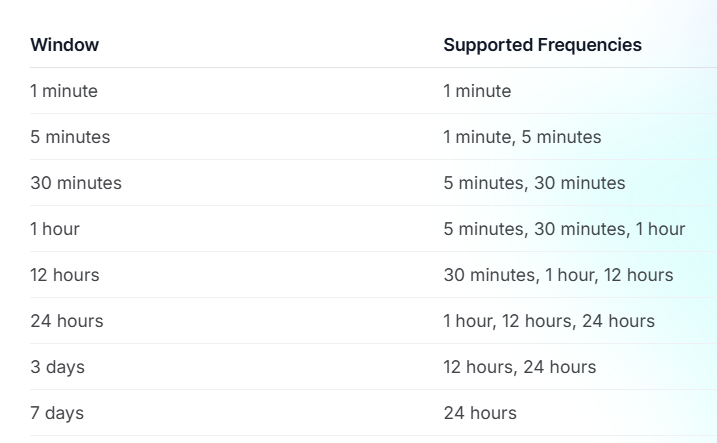
Choosing the right evaluation window and frequency.
The evaluation window and frequency work together to determine how your alerts behave.
The window defines the time period the system analyses, while the frequency defines how often it runs that analysis.
Not every combination is available.
For example:
- A 1-minute window can only be checked every 1 minute.
- A 1-hour window can be checked every 5 minutes, every 30 minutes, or every hour.
- A 7-day window can only be checked once every 24 hours.
Behind the scenes, the system checks all due alert rules every minute and processes them according to their individual schedules.
So even if your alert is set to evaluate every hour, the system is still checking every minute to see if it is time to run your rule.
The key trade-off is between responsiveness and noise.
- A 1-minute window checked every minute will catch problems almost instantly, but it might also fire on brief, harmless spikes.
- A 1-hour window checked every hour is much calmer, but means you could wait up to an hour to learn about a problem.
For issues like API errors or function failures, a shorter window and higher frequency make sense, since these problems require immediate attention.
#9 Notify via.
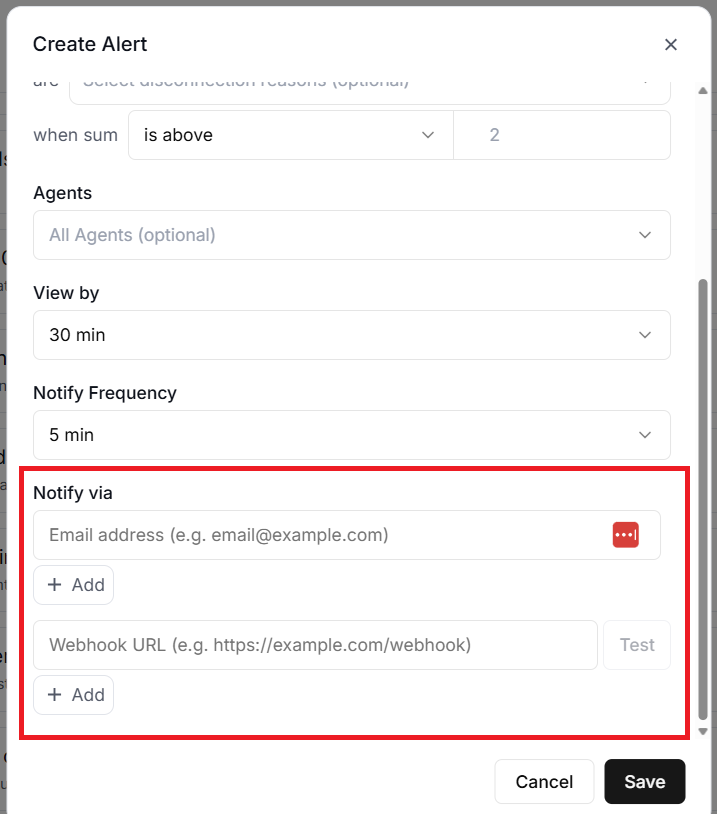
‘Notify via’ denotes the notification channels (Email addresses and/or webhook URLs).
Alerts are only useful if they reach the right people at the right time.
Retell AI supports two notification channels.
- Email notifications.
- Webhook notifications.
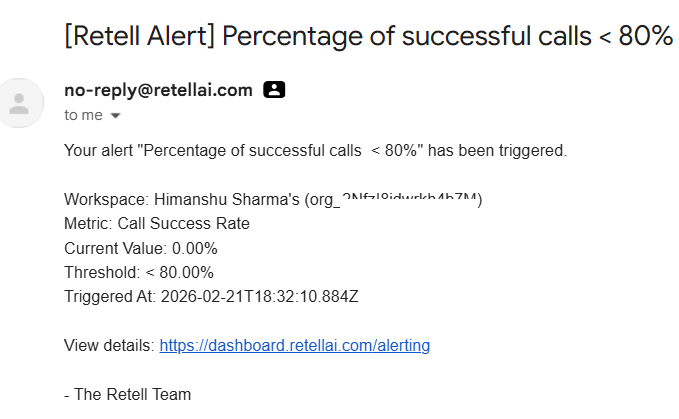
#1 Email notifications.
Email notifications send a message to every configured email address when an alert triggers.
The email includes the alert rule name, the metric type, the current value, the threshold that was breached, and the timestamp.
This is the simplest option and works well for alerts that do not need an immediate response.
#2 Webhook notifications.
Webhook notifications send a POST request to a URL you specify. This is the more powerful option because it lets you integrate alerts with external systems.
For example, you could route alerts to a Slack channel, trigger a PagerDuty incident, kick off an n8n workflow, or feed them into any custom monitoring system you have built.
The webhook payload includes all the details you need to take action programmatically. It contains the alert rule ID, the incident ID, the metric type, the threshold configuration, the current value, and the timestamp.
One important detail is that every webhook request includes a signature header called X-Retell-Signature.
This is an HMAC-SHA256 signature that you should verify using your API key to confirm the request genuinely came from Retell AI.
Always verify this signature in production to prevent anyone from sending fake alert notifications to your webhook endpoint.
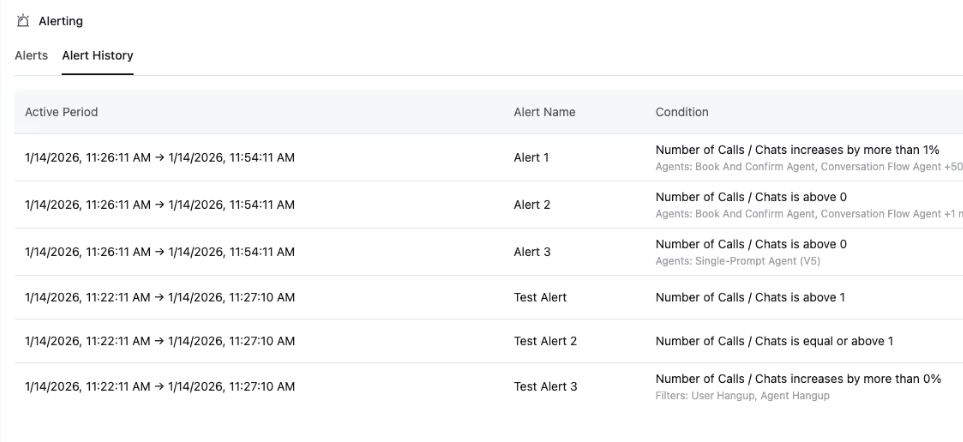
How alert incidents work.
When an alert rule's condition is met, the system creates an alert incident. Understanding the incident lifecycle helps you make sense of what you see in the dashboard.
An incident starts in the triggered state. This is when the metric first breaches your threshold. At this point, notifications are sent to all your configured channels.
The incident then moves to active while the condition remains true. Importantly, you do not receive repeated notifications during this phase.
For example, if your call count alert fires because you exceeded 500 calls in an hour, you get one notification, not a new one every time the system re-evaluates and finds the count still above 500.
Finally, when the metric drops back below the threshold, the incident is marked as resolved.
Currently, Retell AI does not send automatic resolution notifications, so you will need to check the dashboard to see when incidents clear.
Only one incident can be active per alert rule at any given time. If the alert resolves and then triggers again later, that creates a new incident with a new notification.
Limits to keep in mind.
There are two important limits to be aware of.
- Each organisation can have up to 10 alert rules. This means you need to be thoughtful about which metrics matter most, rather than creating alerts for everything.
- Webhook requests have a 10-second timeout, so make sure your webhook endpoint responds quickly. If it takes longer than 10 seconds, the delivery will be considered failed.
Practical recommendations for getting started.
If you are setting up alerting for the first time, here is a sensible starting point.
Begin with a cost alert using an absolute threshold on Total Call Cost with a 24-hour window. This protects your budget.
Add a success rate alert using Call Success Rate with a 1-hour window and a threshold below 80%, checking every 30 minutes. This catches agent problems before they affect too many callers.
Once you have these basics in place, observe the patterns for a week or two.
Adjust thresholds based on what you learn about your normal operating ranges.
The goal is to get alerts that are meaningful and actionable, not so sensitive that you start ignoring them.
Related Articles:
- How to Self Host n8n on Google Cloud - Tutorial.
- How to use APIs in n8n, GoHighLevel and other AI Automation Workflows.
- How to use Webhooks in n8n, GoHighLevel and other AI Automation Workflows.
- What is OpenRouter API and how to use it.
- How to Connect Google Analytics to n8n (step by step guide).
- How To Connect Google Analytics MCP Server to Claude.
- State Machine Architectures for Voice AI Agents.
- Using Twilio with Retell AI via SIP Trunking for Voice AI Agents.
- Retell Conversation Flow Agents - Best Agent Type for Voice AI?
- How to build Cost Efficient Voice AI Agent.
- When to Add Booking Functionality to Your Voice AI Agent.
- n8n Expressions Tutorial.
- n8n Guardrails Guide.
- Modularizing n8n Workflows - Build Smarter Workflows.
- How to sell on ChatGPT via Instant Checkout & ACP (Agentic Commerce Protocol).
- How to Build Reliable AI Workflows.
- Correct Way To Connect Retell AI MCP Server to Claude.
- How to setup Claude Code in VS Code Editor.
- How to use Claude Code Inside VS Code Editor.
- How To Connect n8n MCP Server to Claude.
- How to Connect GoHighLevel MCP Server to Claude.
- How to connect Supabase and Postgres to n8n.
- How to Connect WhatsApp account to n8n.
- How to make your AI Agent Time Aware.
- Structured Data in Voice AI: Stop Commas From Being Read Out Loud.
- How to build Voice AI Agent that handles interruptions.
- Error Handling in n8n Made Simple.
- How to Write Safer Rules for AI Agents.
- AI Default Assumptions: The Hidden Risk in Prompts.
- Why AI Agents lie and don't follow your instructions.
- Why You Need an AI Stack (Not Just ChatGPT).
- How to use OpenAI Agent Kit, Agent Builder?
- n8n AI Workflow Builder And Its Alternatives.
- Two-way syncs in automation workflows can be dangerous.
- Missing Context Breaks AI Agent Development.
- How To Avoid Billing Disputes With AI Automation Clients.
- ChatGPT prompt to summarize YouTube video.
- Avoid the Overengineering Trap in AI Automation Development.
- How to Correctly Self Host n8n on Hostinger VPS.
- The correct way to setup Cal.com for Voice AI.
- Custom Reporting For Voice AI.
- How To Bill Your Voice AI Clients Like A Pro.
- Voice AI Knowledge Base Creation Best Practices.
- How to build Cost Efficient Voice AI Agent.