

To conduct organic search traffic analysis in GA4, we will create a new exploration report from scratch. This new report would have nine tabs.
Each tab displays one sub-report that measures the performance of your organic search traffic.
The exploration report has the following sub-reports:
1. Overview – This report provides an overview of each organic search traffic source.
2. Landing Pages – Use this report to measure the performance of landing pages for organic search traffic.
3. Devices – Use this report to measure the performance of different devices (desktop, mobile, smart TV, tablet) which send organic search traffic to your website.
4. Browsers – Use this report to measure the performance of different web browsers which send organic search traffic to your website.
5. Countries – Use this report to determine where organic search traffic is coming to your website.
6. Conversions – Use this report to determine all the conversions generated by organic search traffic on your website.
7. ECommerce – Use this report to measure the ecommerce performance of organic search traffic to your website.
8. User Flow – Use this report to determine how the organic search traffic is using your website.
9. Funnel – Use this report to determine how organic search traffic converts on your website.

#1 Creating the ‘Overview’ report.
Follow the steps below:
Step-1: Make sure that your GA4 property has collected at least 30 days of historical data before you move forward. Otherwise, your data analysis would not be statistically significant.
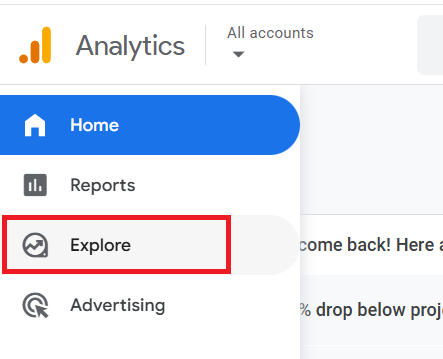
Step-2: Login to your GA4 property and then click on the ‘Explore’ link:
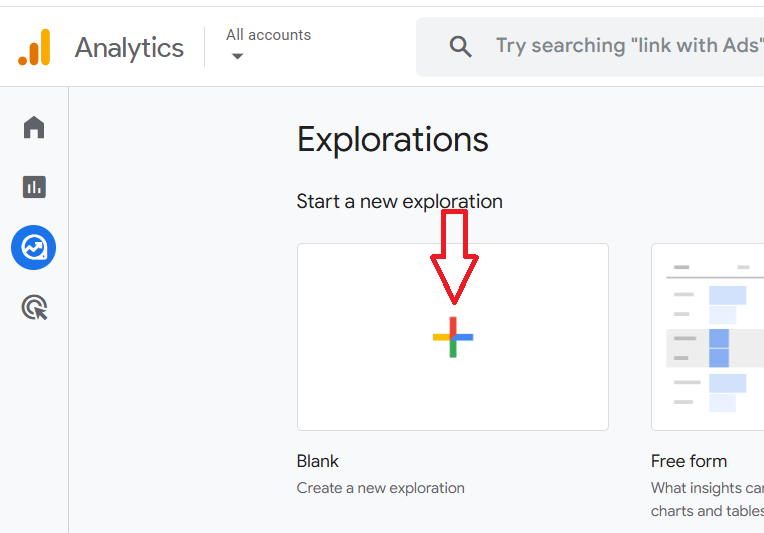
Step-3: Click on the ‘Blank’ exploration report template:
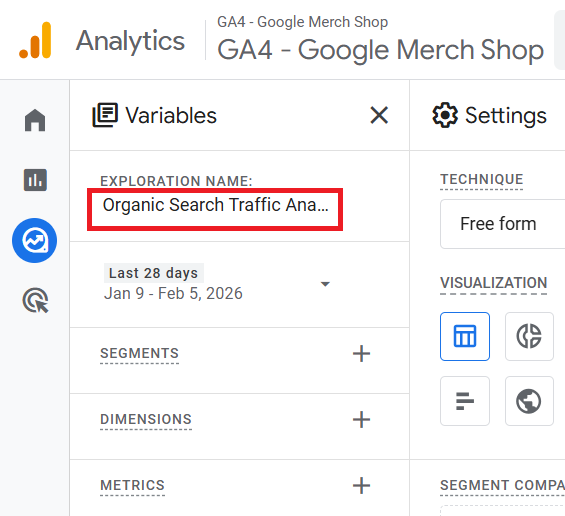
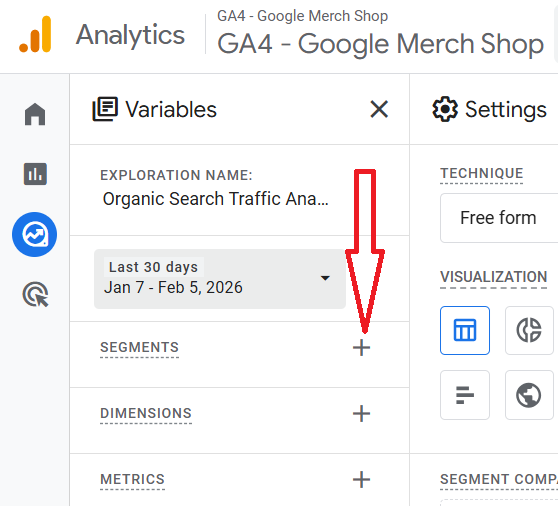
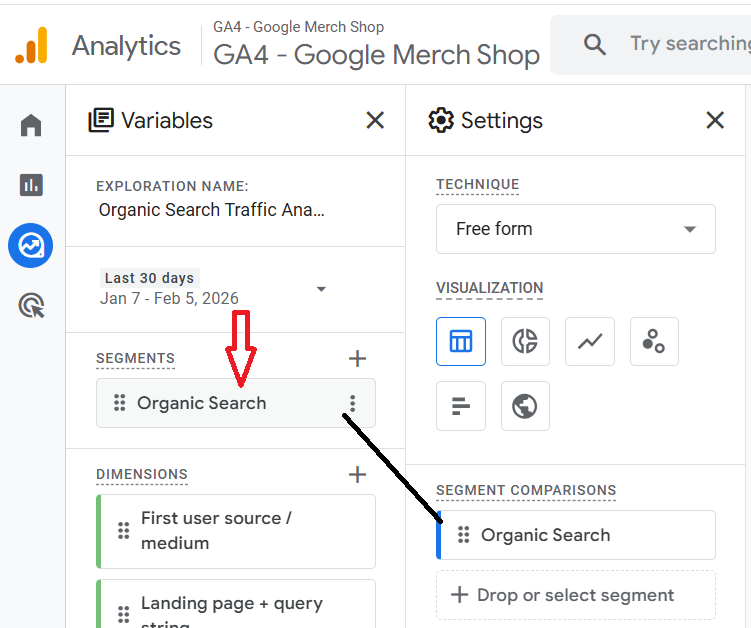
Step-4: Name your report ‘Organic Search Traffic Analysis’:
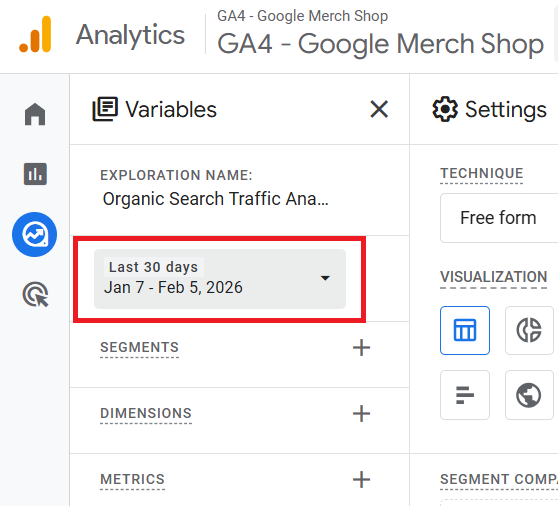
Step-5: Set the date range to the last 30 days:
Step-6: Click on the + button next to SEGMENTS:
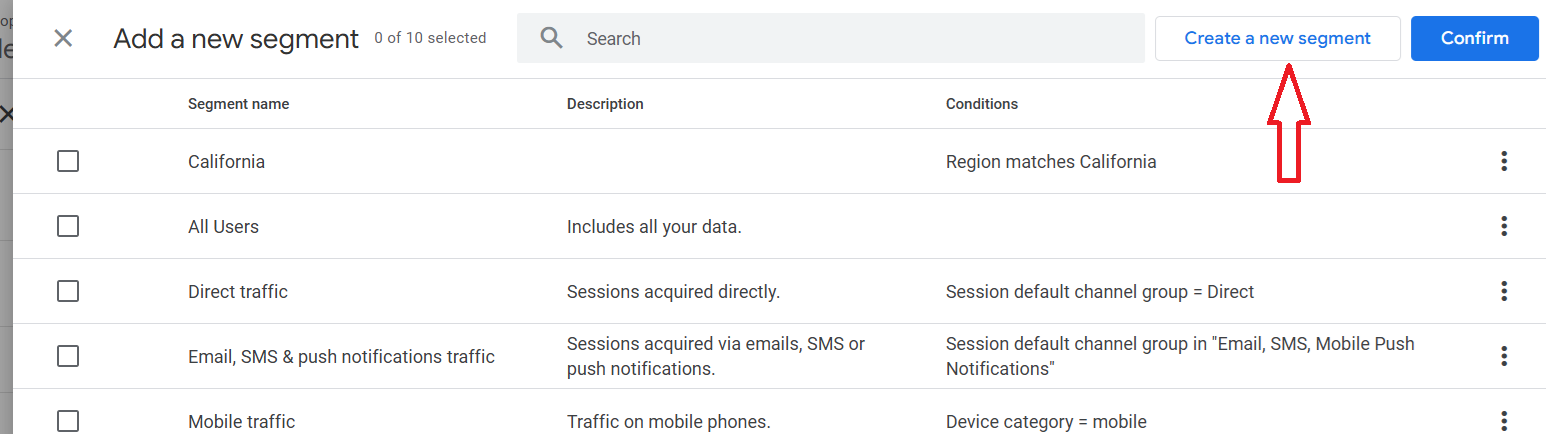
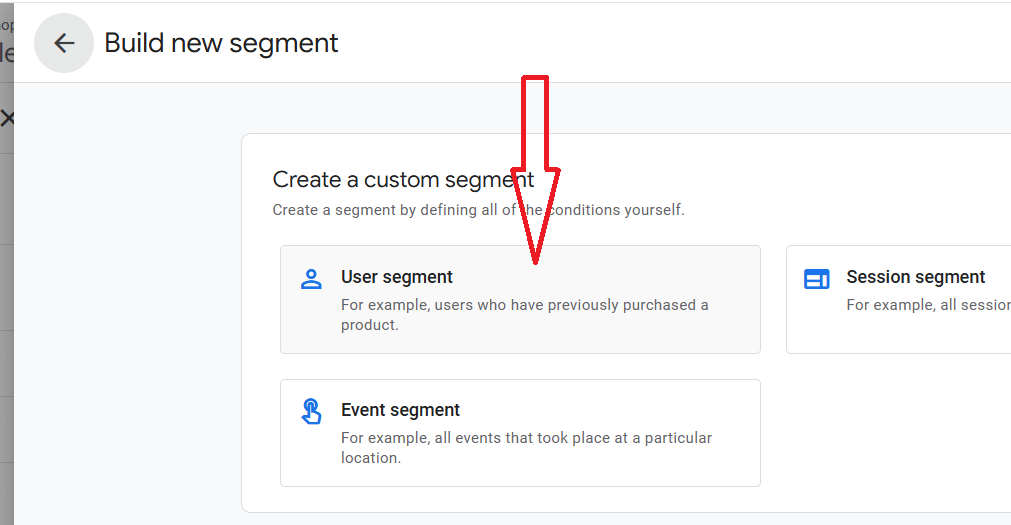
Step-7: Click on the ‘Create a new segment’ button and then on the ‘User Segment’ button:
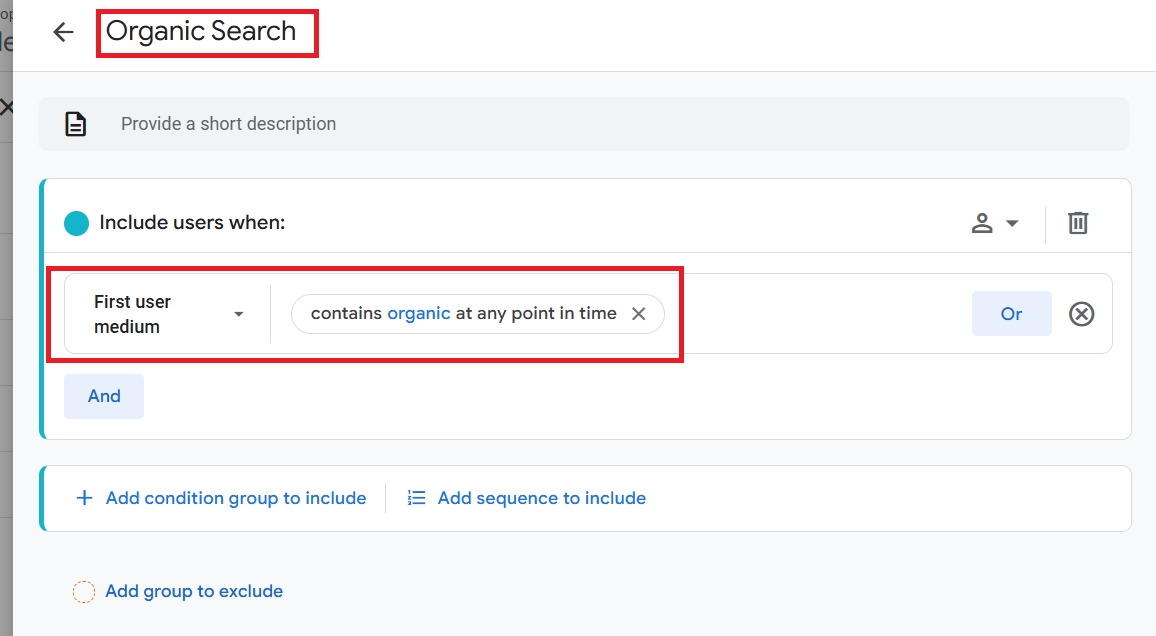
Step-8: Name the new segment ‘Organic Search’ and define it like the one below:
Step-9: Click on the ‘APPLY’ button at the top right-hand side.
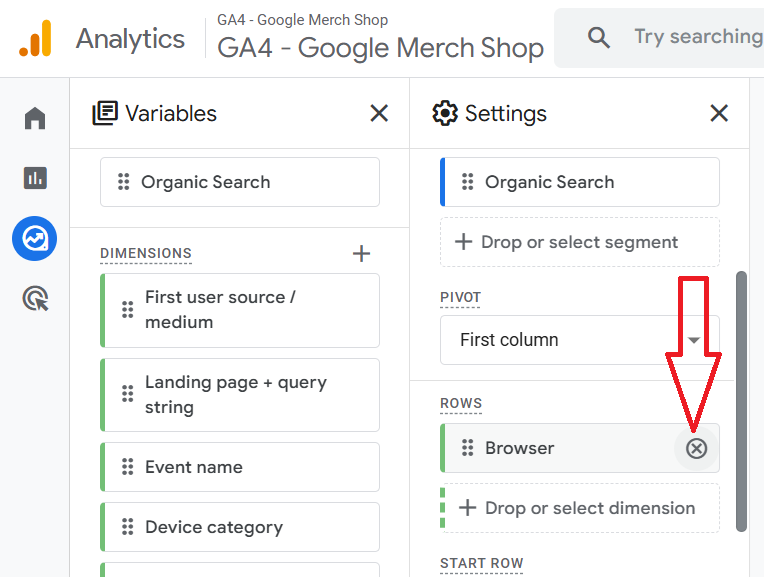
Step-10: Click on the + button next to ‘DIMENSIONS‘ and then import the following dimensions to the report in the exact order as they are listed:
- First user source/medium.
- Landing page + query string.
- Event name.
- Device category.
- Browser.
- Country.
- Item name.
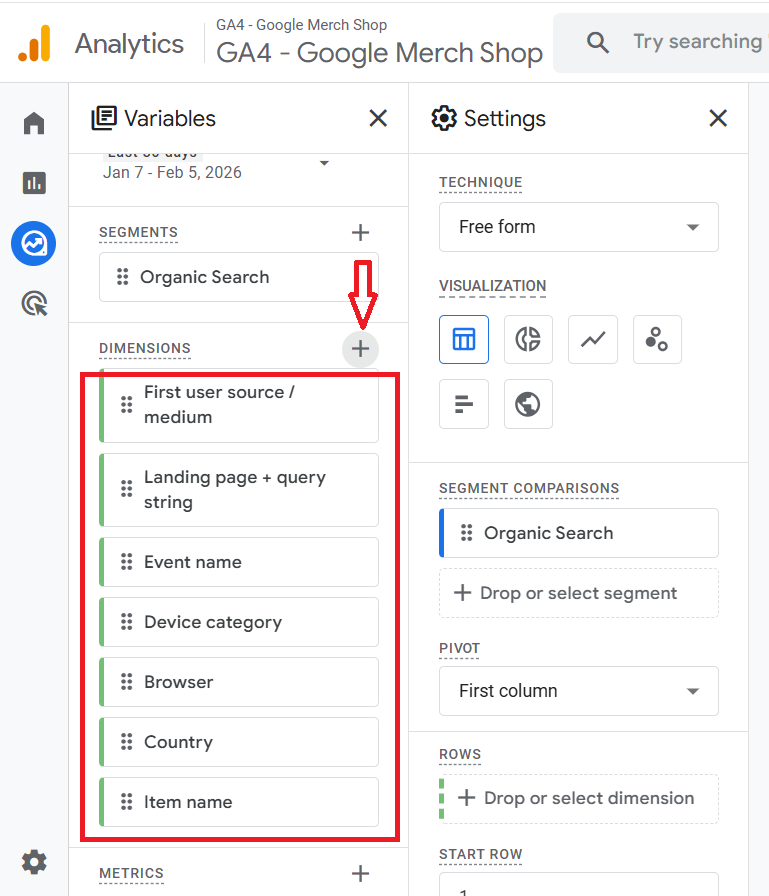
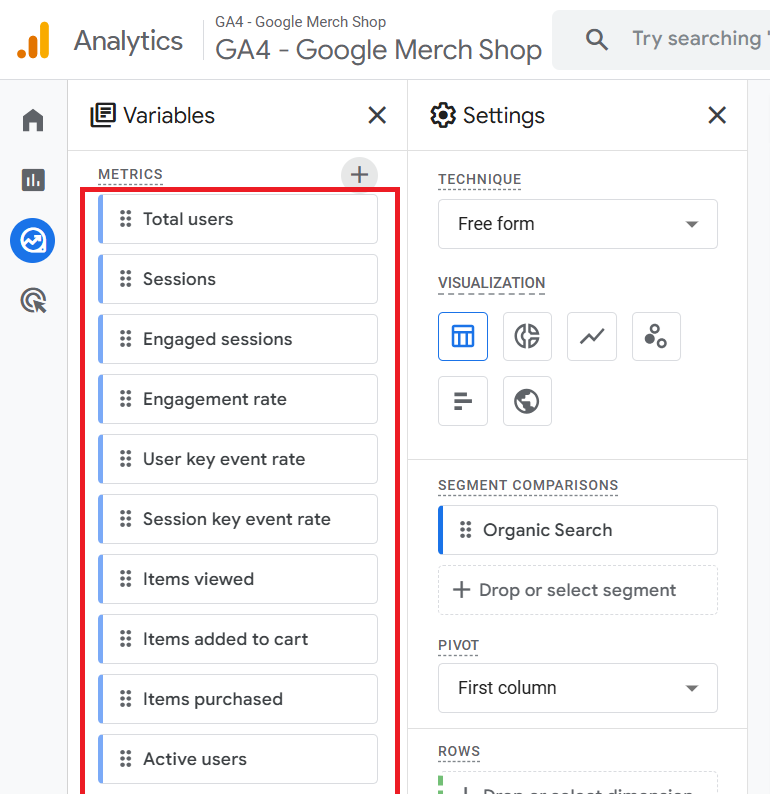
Step-11: Click on the + button next to METRICS and then import the following metrics to the report in the exact order as they are listed:
- Total users.
- Sessions.
- Engaged sessions.
- Engagement rate.
- Items viewed.
- Items added to cart.
- Items purchased.
- Active users.
- Views.
- Event count.
- Key events.
- Total revenue.
- Item revenue.
Step-12: Double-click on the dimension ‘First user source/medium’ so that it is automatically added to the Rows section:
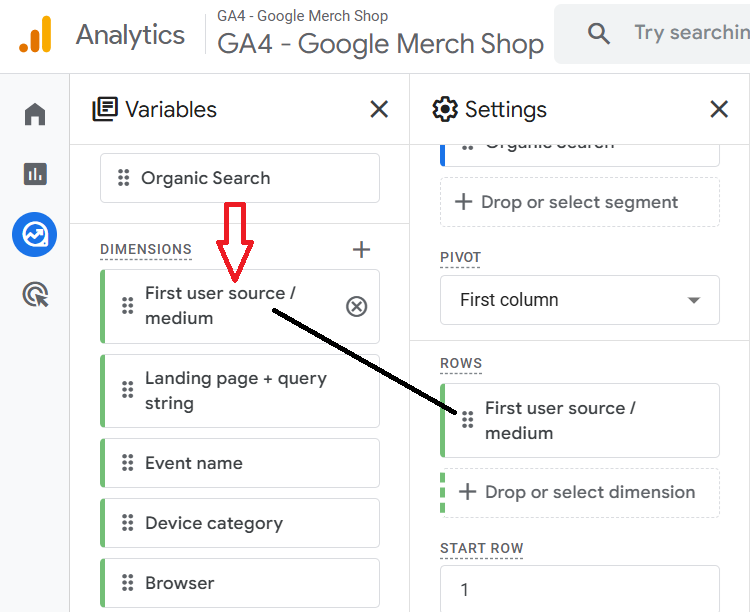
Note: When you double-click on the ‘First user source/medium’ dimension, you won’t see any change to the canvas on the right. But the dimension has been added to the canvas. Only when you start adding metrics to the canvas will you start seeing the dimension(s) added to the canvas.
Step-13: Double-click on the following metrics one by one, starting from the very top, so that they are automatically added to the blank canvas on the right:
- Views.
- Total users.
- Sessions.
- Engaged sessions.
- Engagement rate.
- Event Count.
- Key Events.
- Total revenue.
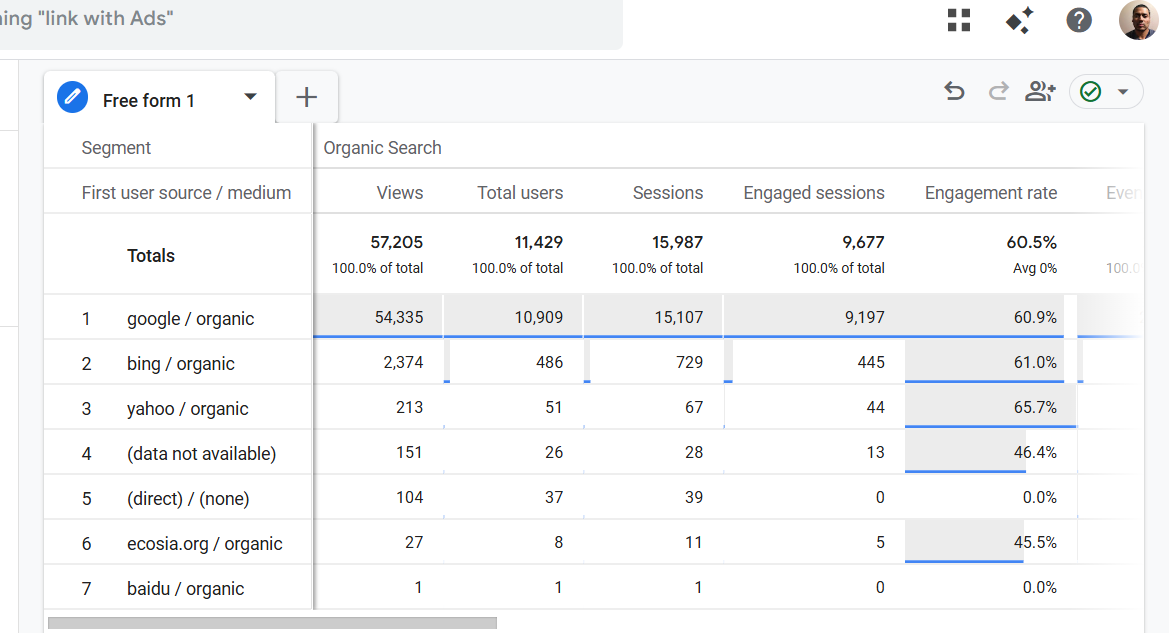
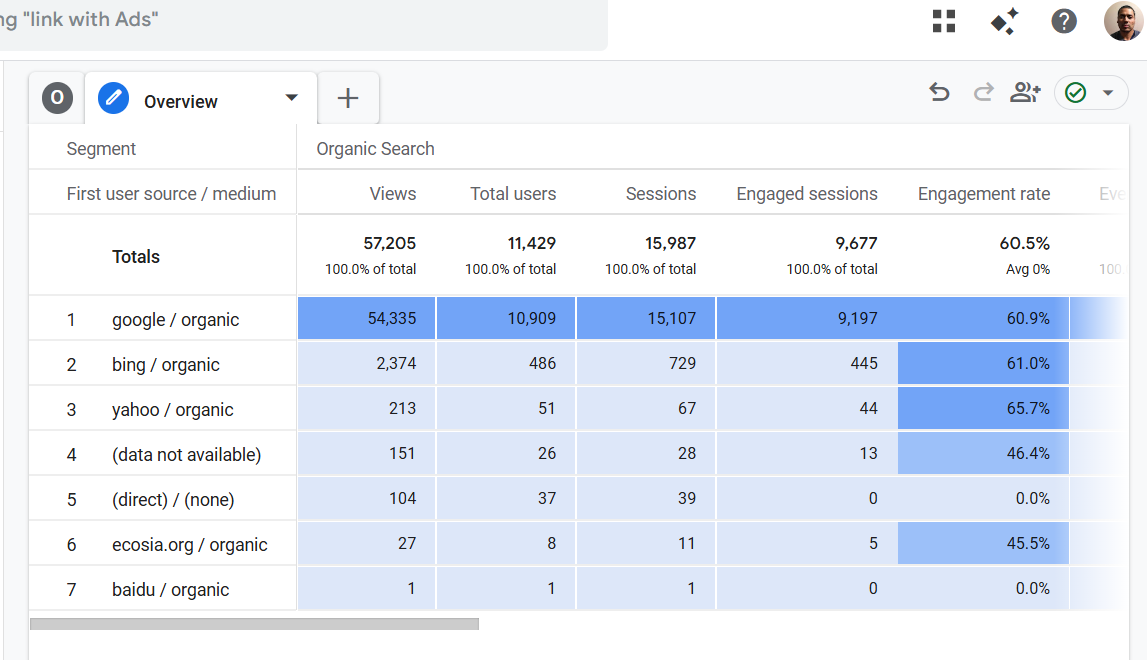
You should now be able to see the dimensions and metrics added to the report canvas on the right:
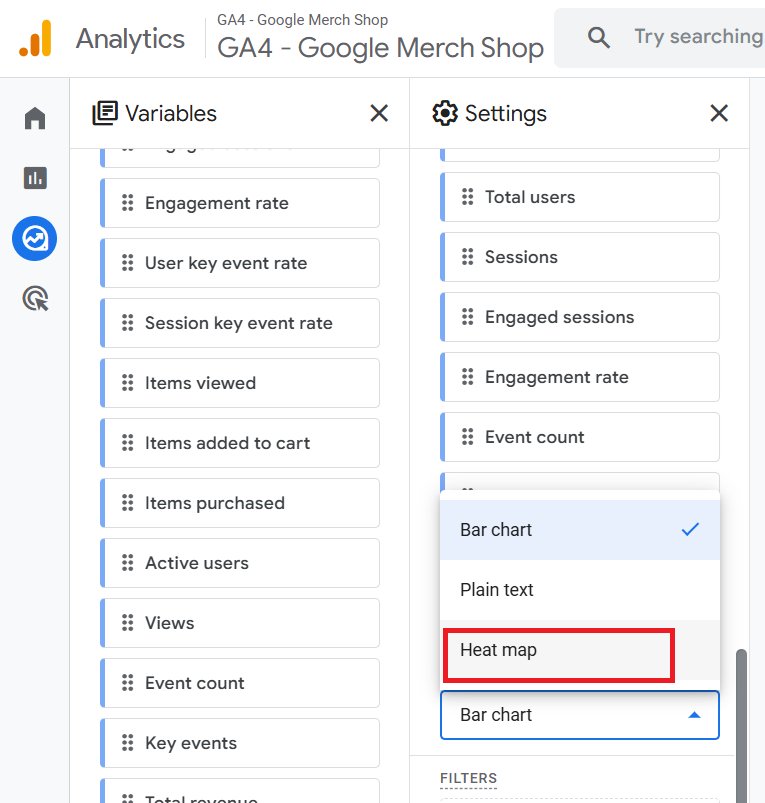
Step-14: Under the ‘Settings’ column, scroll down and then click on the drop-down menu next to ‘Cell Type’:
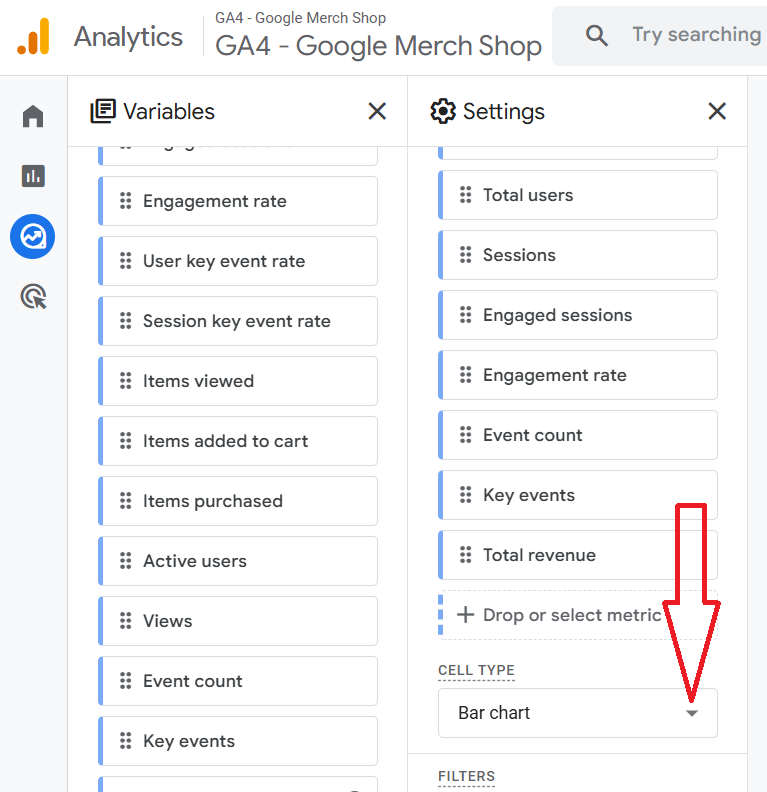
Step-15: Click on ‘Heat Map’ from the drop-down menu:
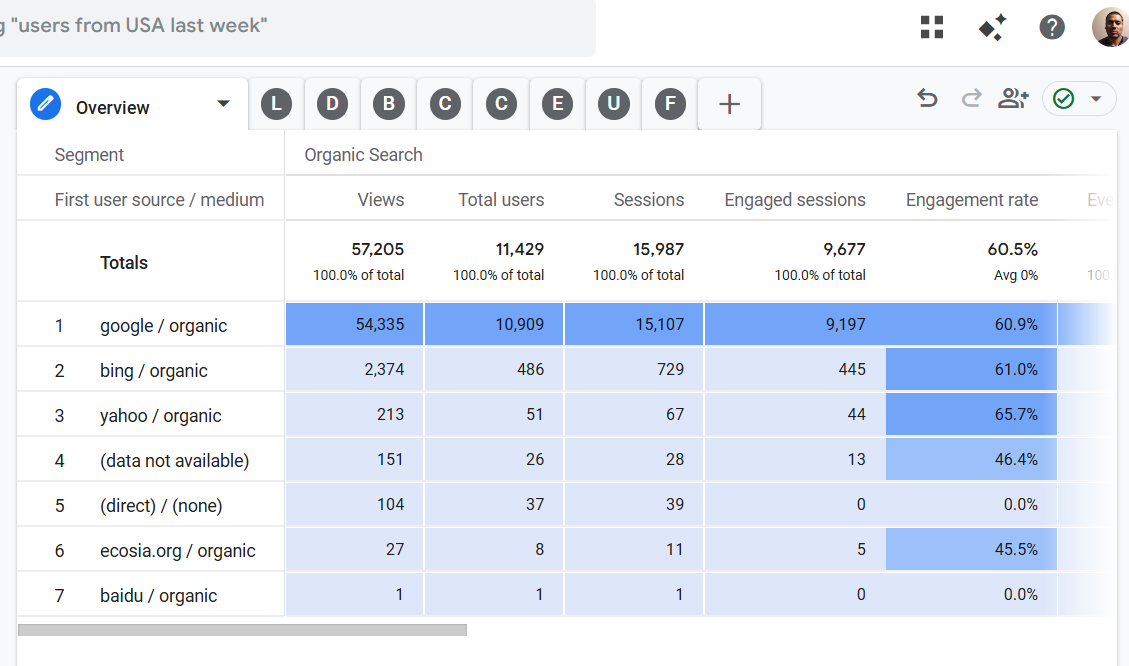
Your report should now look like the one below:
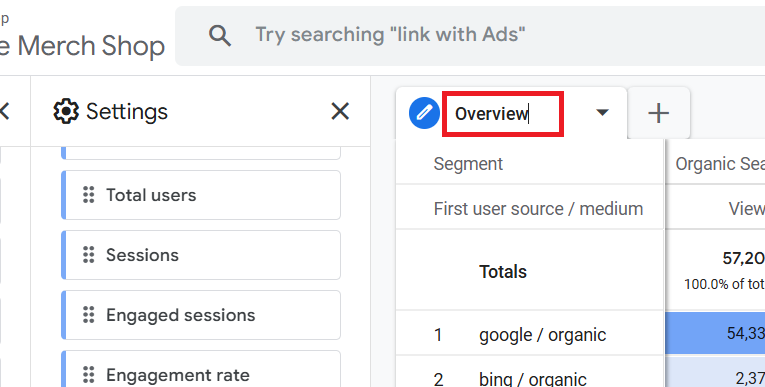
Step-16: Double click on ‘Free form 1’:
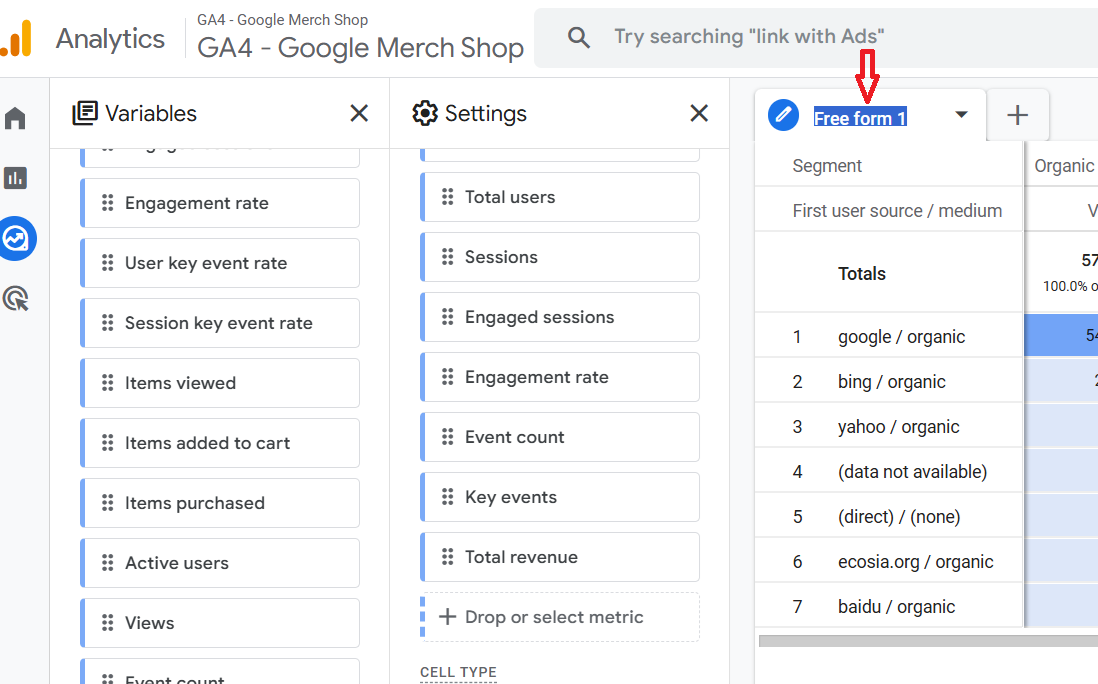
Step-17: Rename the tab to ‘Overview’:
Congratulations!
You have now successfully created the ‘Overview’ report.
#2 Creating the ‘Landing Pages’ report.
Follow the steps below:
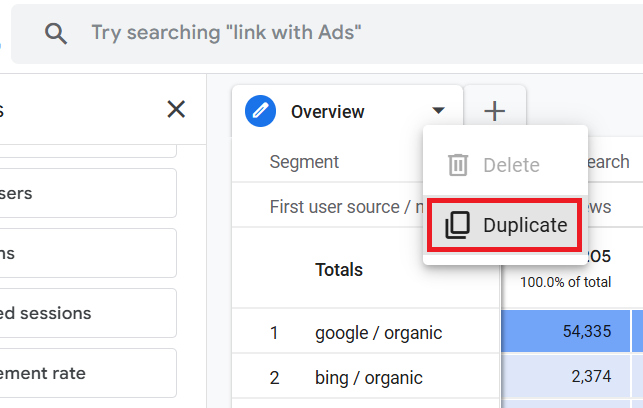
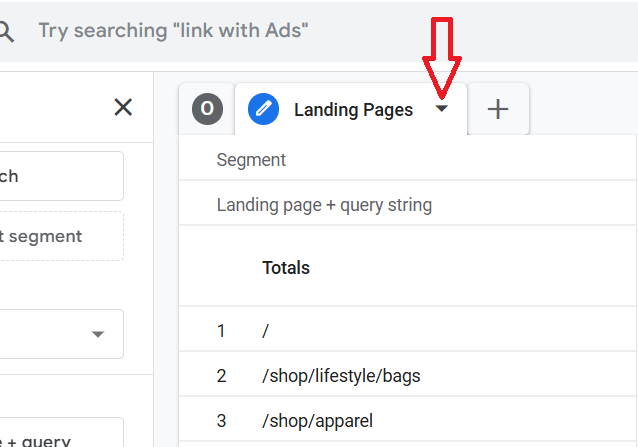
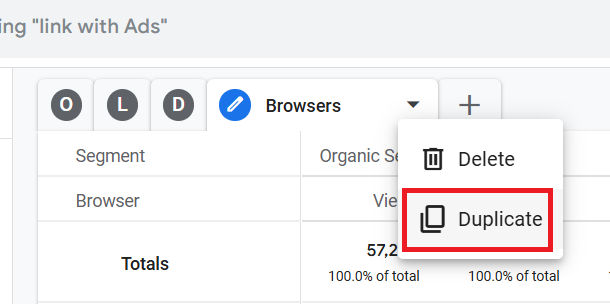
Step-1: Click on the arrow button next to ‘Overview’:
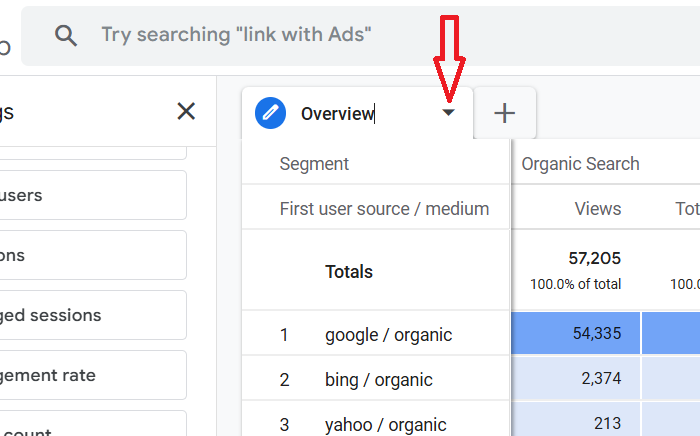
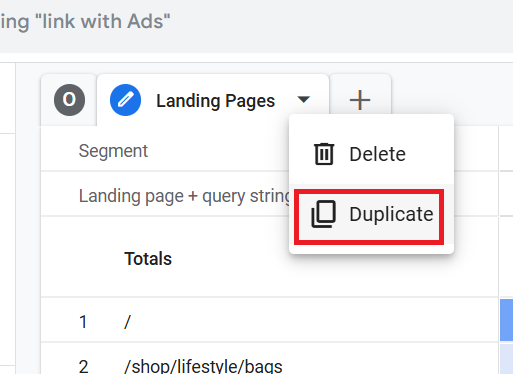
Step-2: Click on ‘Duplicate’ from the drop-down menu:
You should now see a screen like the one below:
Step-3: Name the new tab ‘Landing Pages’ by double clicking on ‘Overview’:
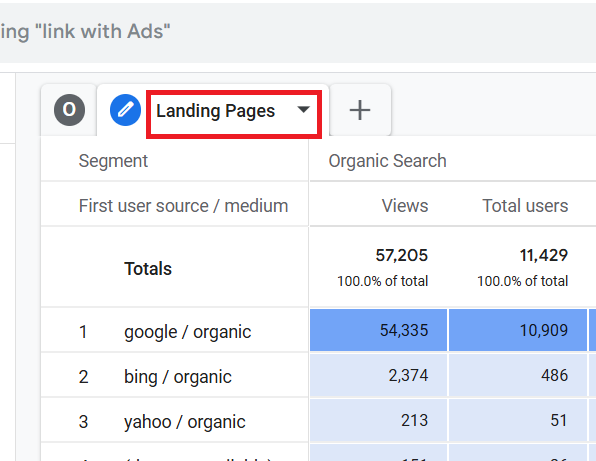
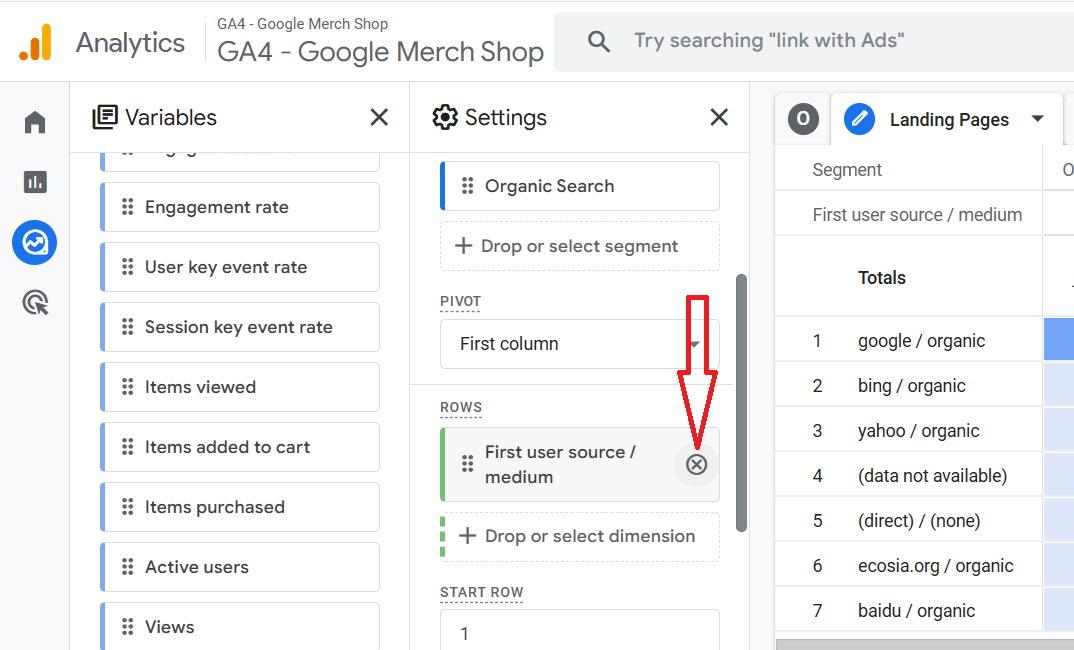
Step-4: Click on the cross button next to the dimension ‘First user source/medium’ in order to remove it from the report:
Step-5: Double click on the dimension ‘Landing Page + query string’ so that it is automatically added to the canvas on the right:
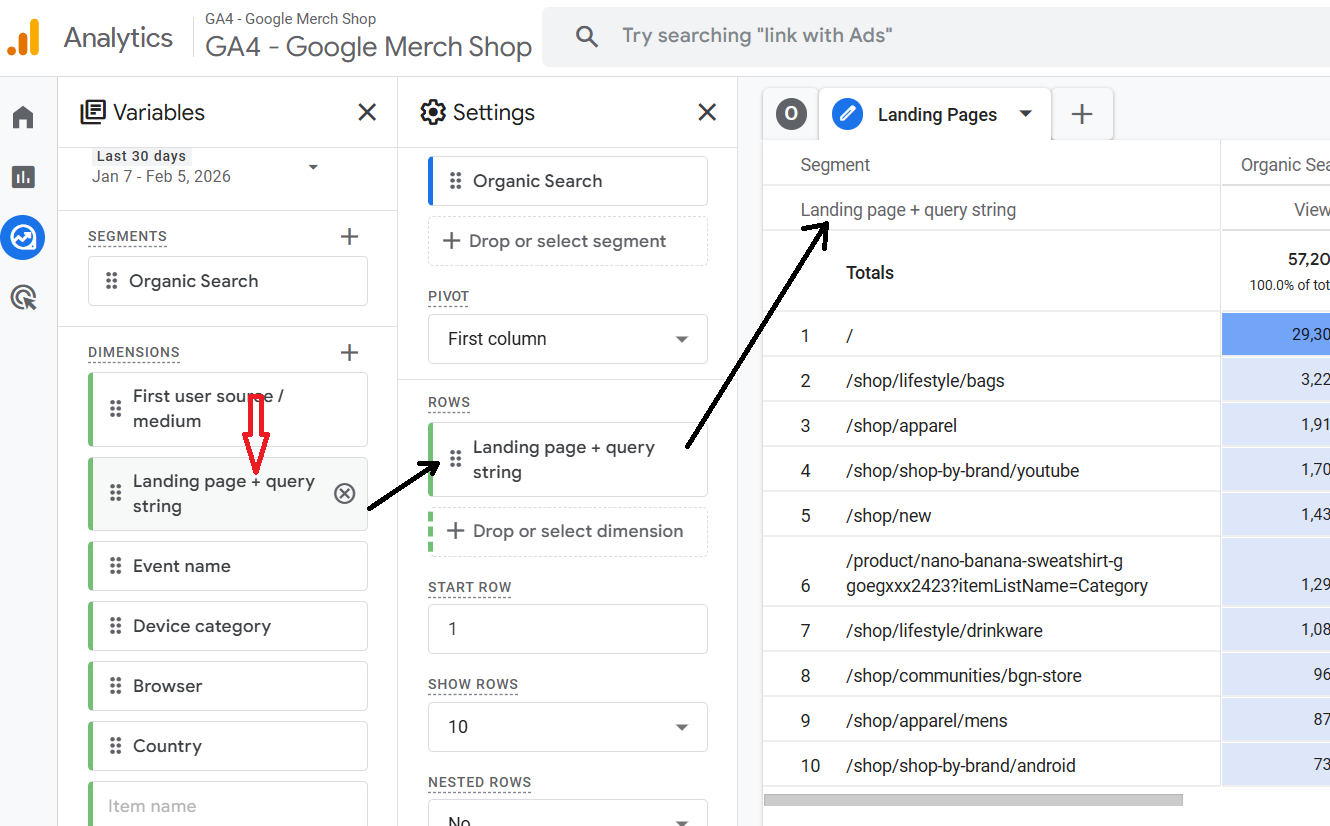
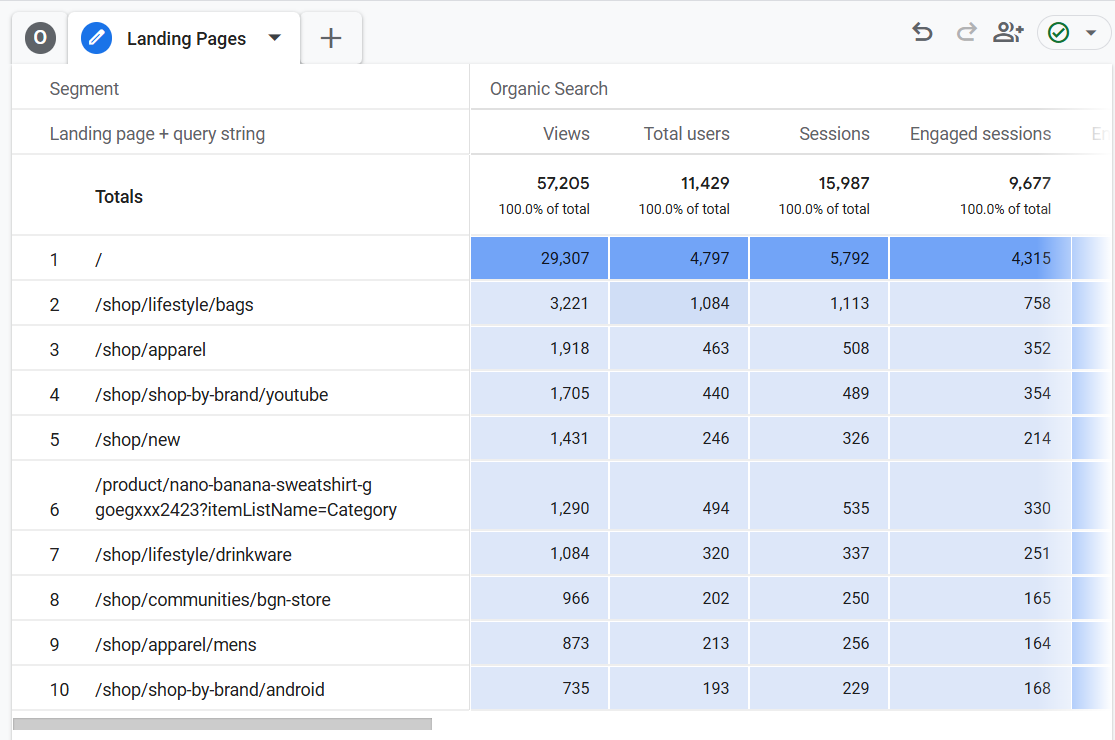
You should now be able to see the ‘Landing Pages’ report on the canvas:
#3 Creating the ‘Devices’ report.
Follow the steps below:
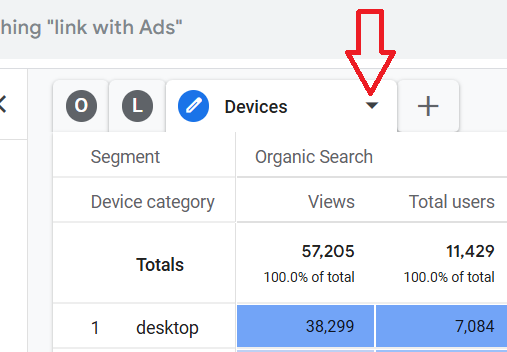
Step-1: Click on the arrow button next to ‘Landing Pages’:
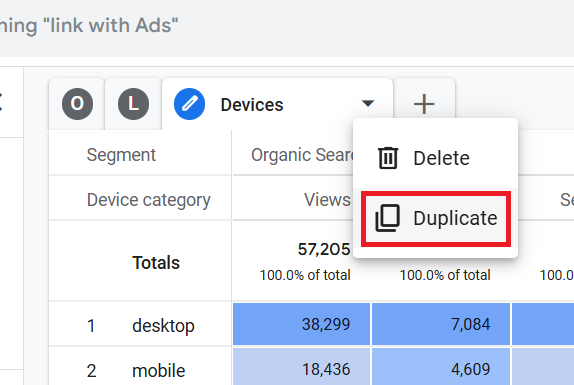
Step-2: Click on ‘Duplicate’ from the drop-down menu:
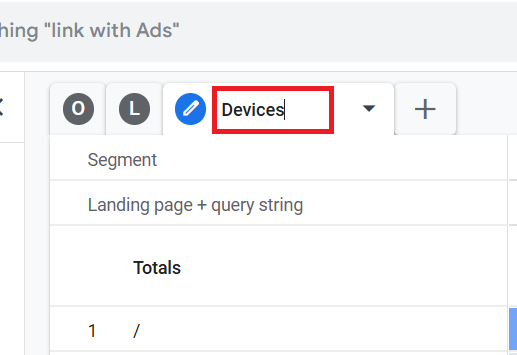
Step-3: Name the new tab ‘Devices’ by double clicking on ‘Landing Pages’:
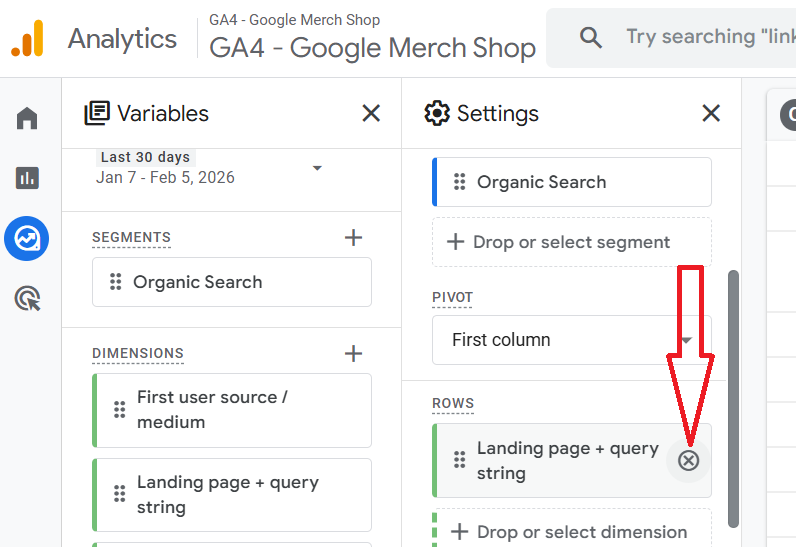
Step-4: Click on the cross button next to the dimension ‘Landing page + query string’ in order to remove it from the report:
Step-5: Double click on the dimension ‘Device Category’ so that it is automatically added to the canvas on the right:
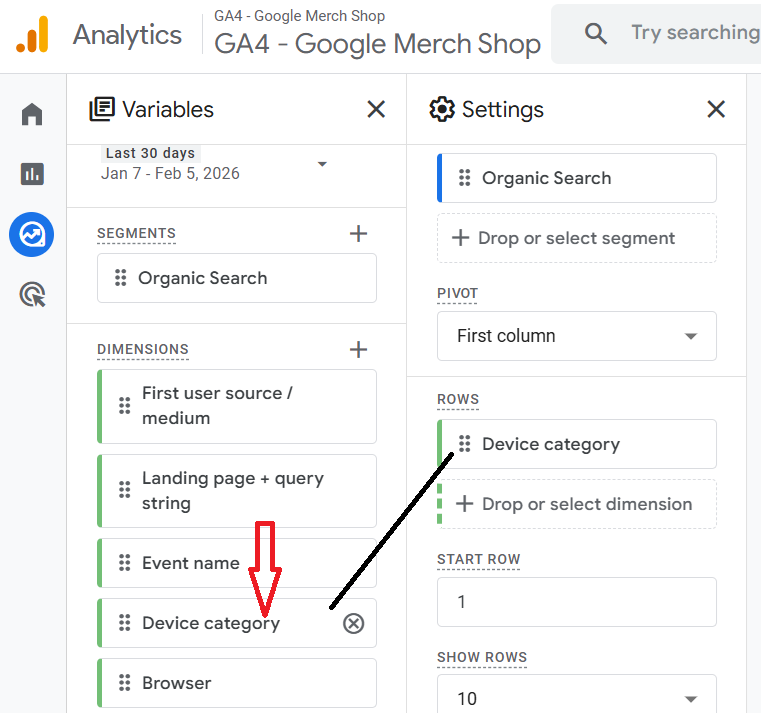
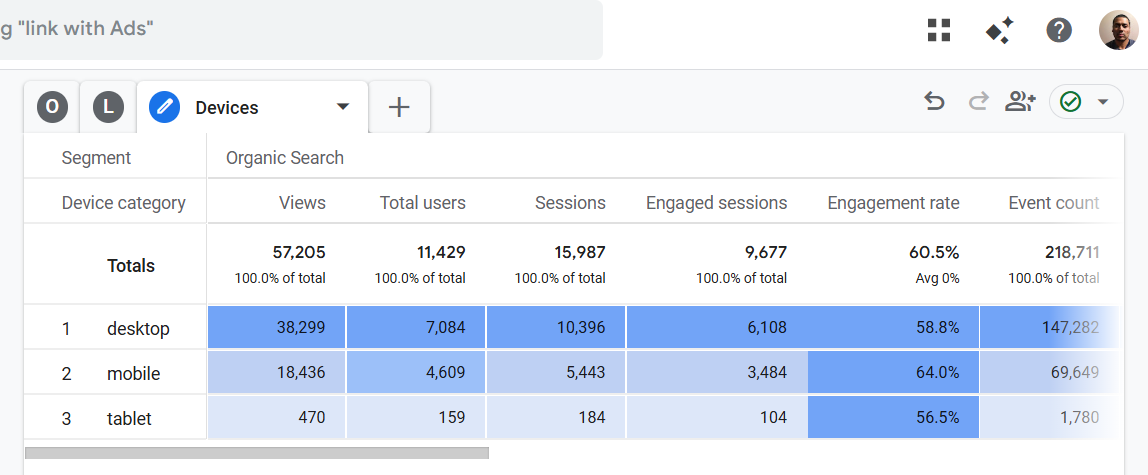
You should now be able to see the ‘Devices’ report on the canvas:
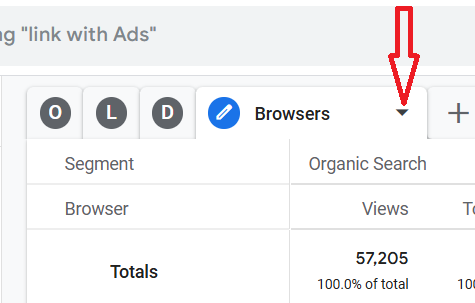
#4 Creating the ‘Browsers’ report.
Follow the steps below:
Step-1: Click on the arrow button next to ‘Devices’:
Step-2: Click on ‘Duplicate’ from the drop-down menu:
Step-3: Name the new tab ‘Browsers’:
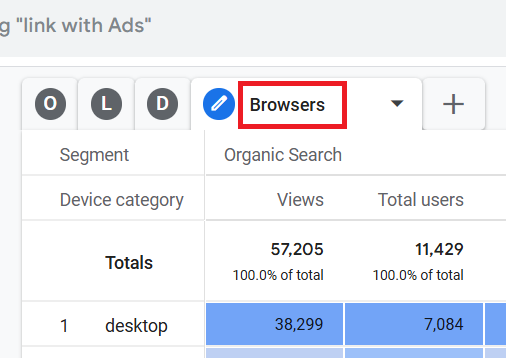
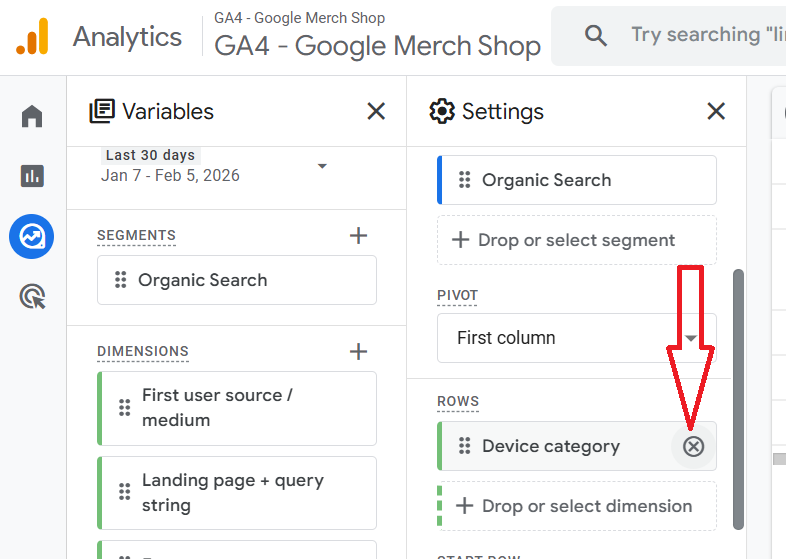
Step-4: Click on the cross button next to the dimension ‘Device Category’ in order to remove it from the report:
Step-5: Double click on the dimension ‘Browser’ so that it is automatically added to the canvas on the right:
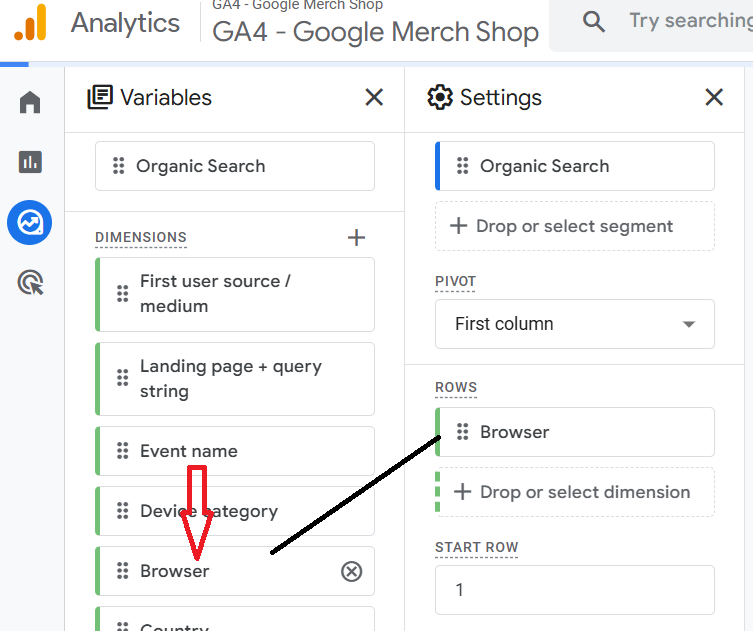
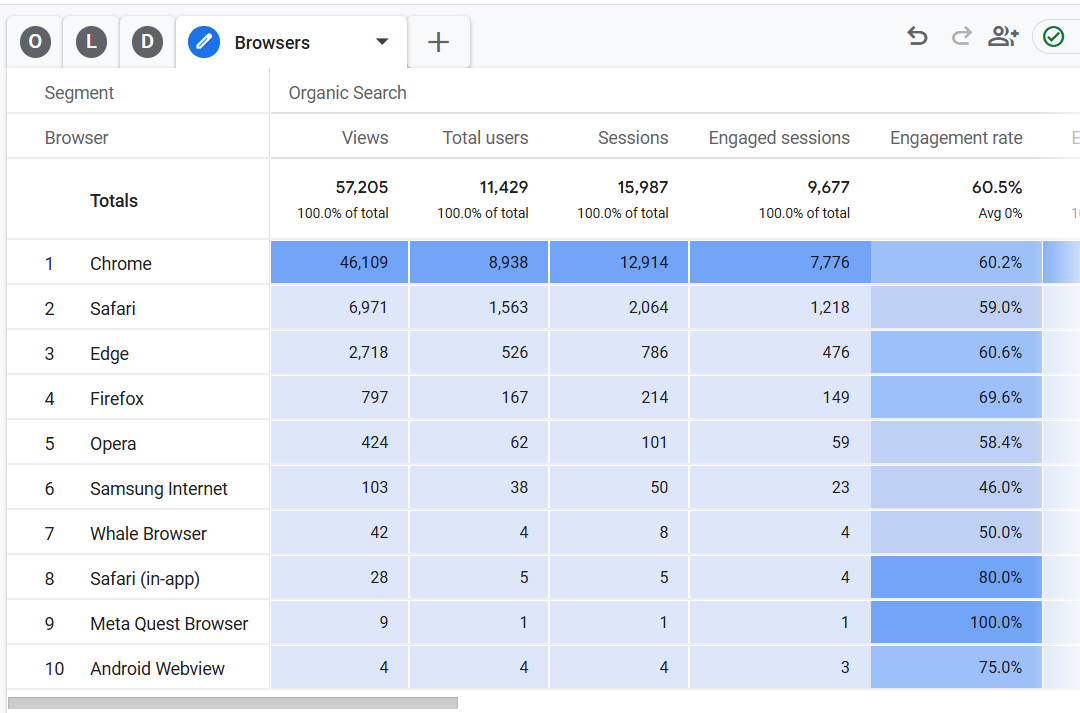
You should now be able to see the ‘Browsers’ report on the canvas:
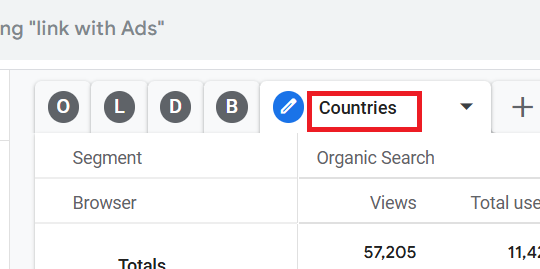
#5 Creating the ‘Countries’ report.
Follow the steps below:
Step-1: Click on the arrow button next to ‘Browsers’:
Step-2: Click on ‘Duplicate’ from the drop-down menu:
Step-3: Name the new tab ‘Countries’:
Step-4: Click on the cross button next to the dimension ‘Browser’ in order to remove it from the report:
Step-5: Double click on the dimension ‘Country’ so that it is automatically added to the canvas on the right:
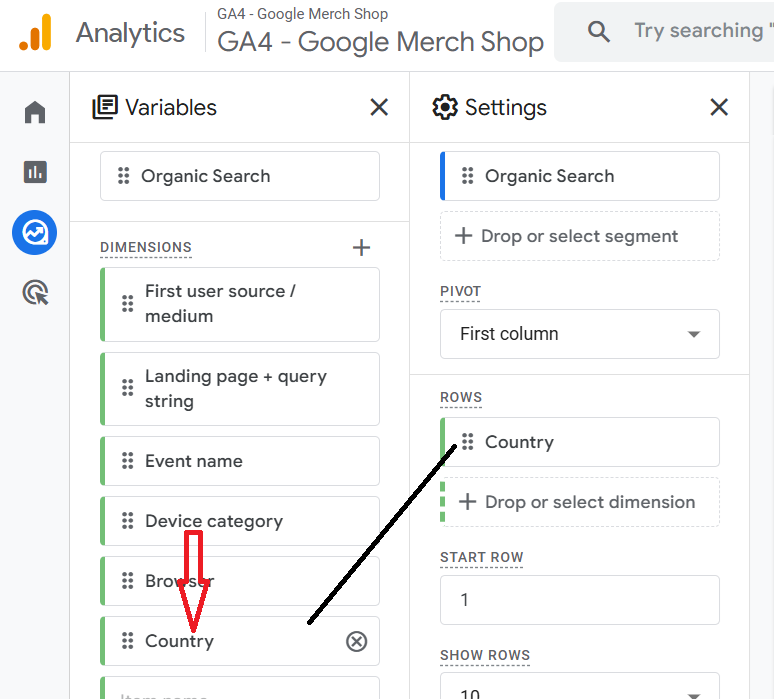
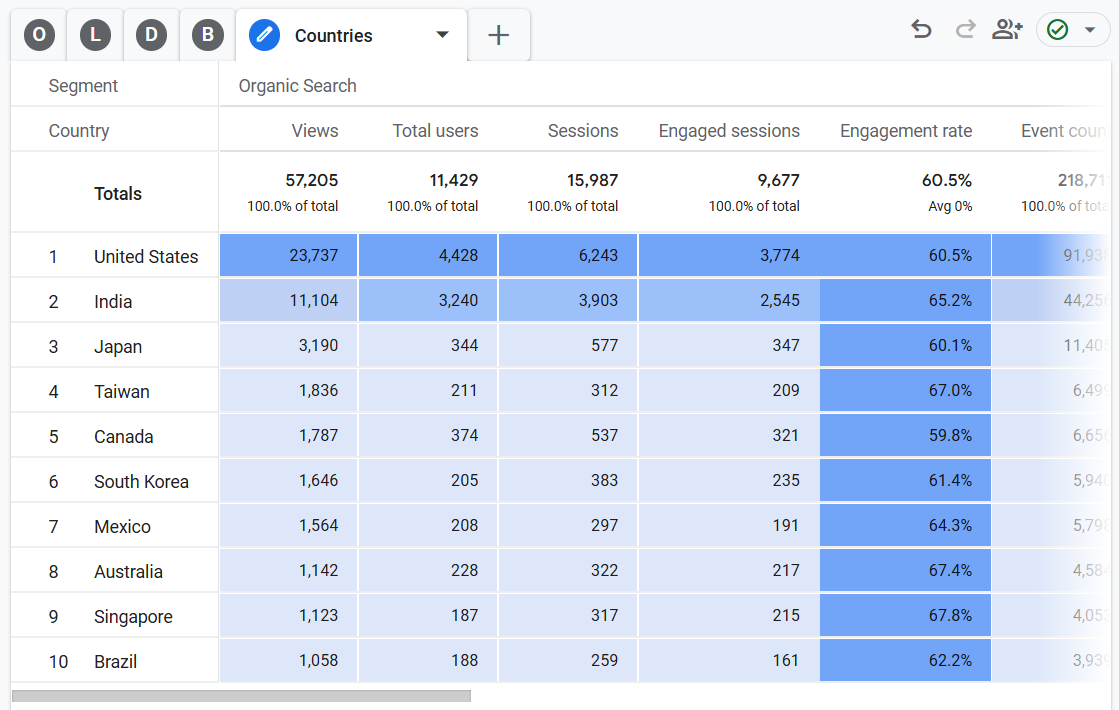
You should now be able to see the ‘Countries’ report on the canvas:
#6 Creating the ‘Conversions’ report.
Follow the steps below:
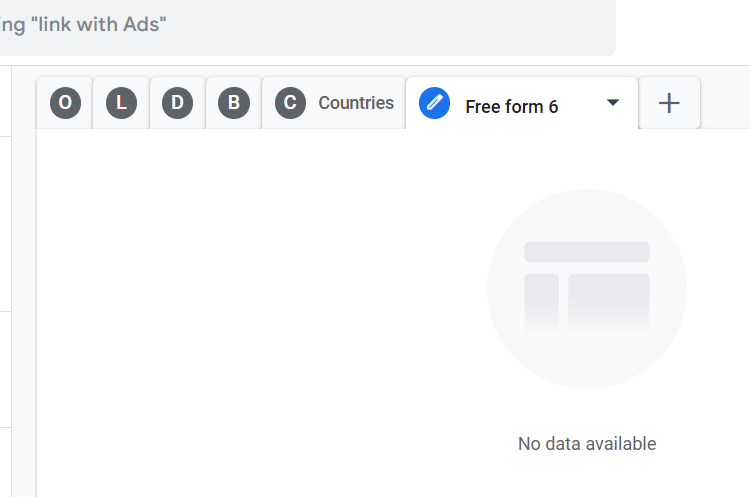
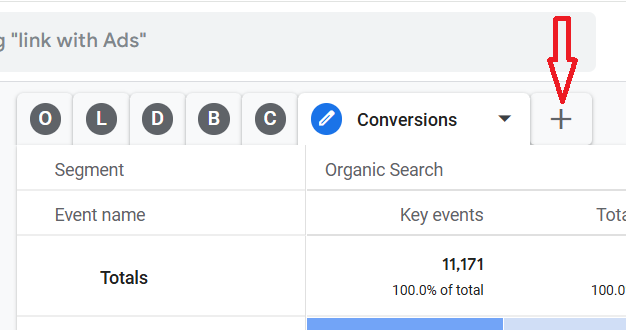
Step-1: Click on the + button next to the ‘Countries’ tab:
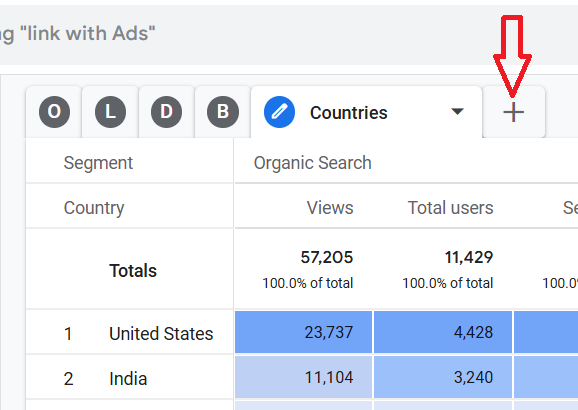
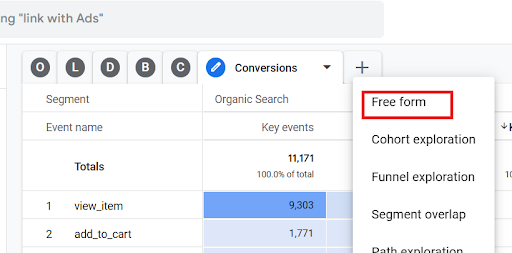
Step-2: Click on ‘Free form’:
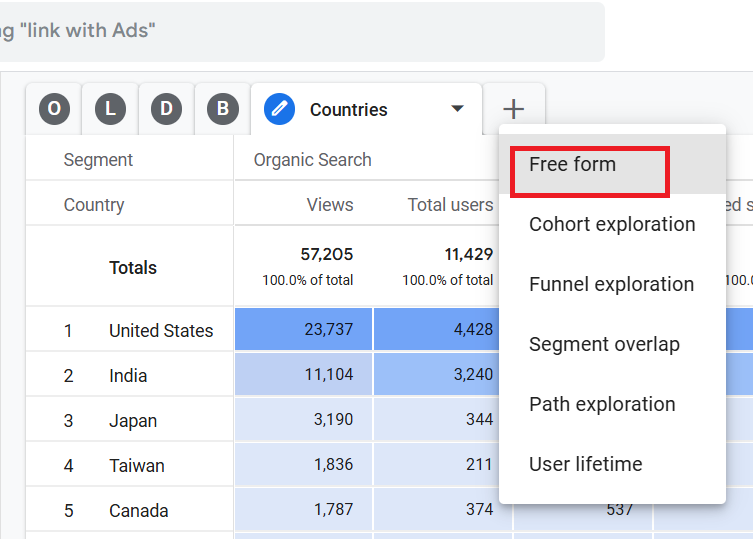
You should now see a screen like the one below:
Step-3: Name the new tab ‘Conversions’:
Step-4: Double-click on the ‘Organic Search’ segment to add it to the panel on the right:
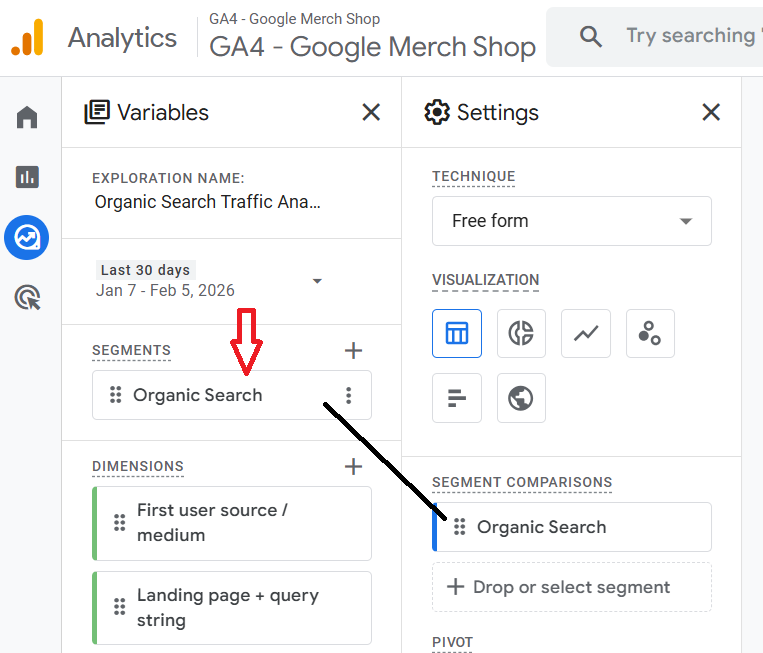
Note: You won’t see the ‘Organic Search’ segment applied to the canvas until you start adding metrics. However, you should see the ‘Organic Search’ segment listed under ‘SEGMENT COMPARISONS’.
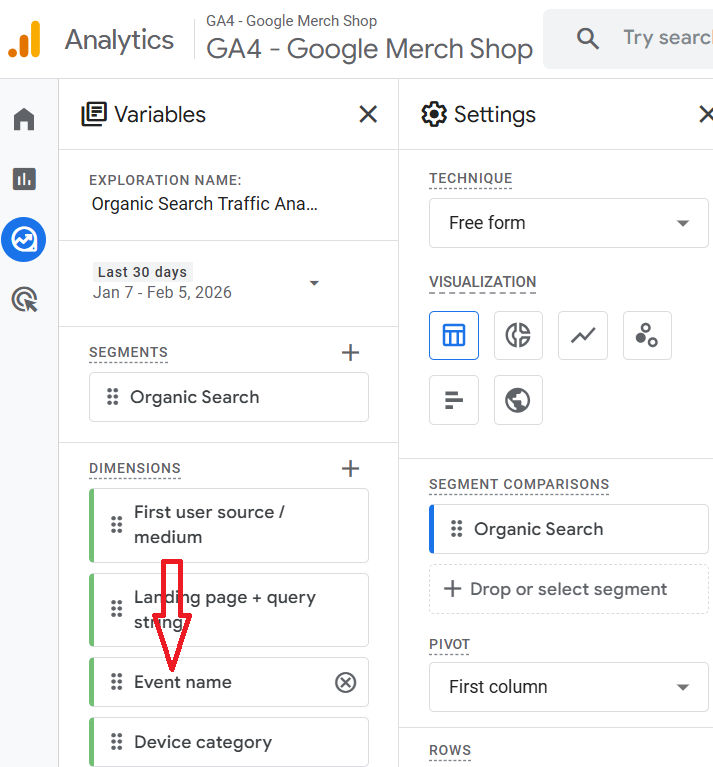
Step-5: Double-click on the ‘Event name’ dimension to add it to the canvas on the right:
Step-6: Double-click on the following metrics one by one in the exact order as mentioned below to add them to the canvas on the right:
- Key Events.
- Total users.
Step-7: Scroll down and select cell type to ‘Heat map’.
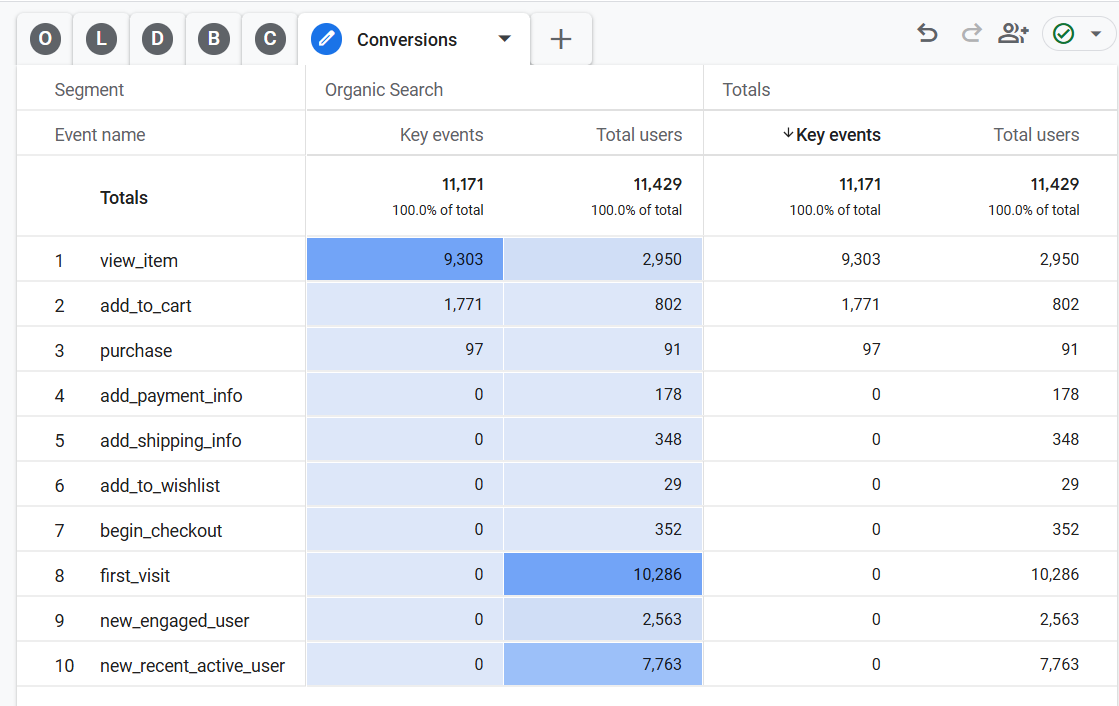
You should now be able to see the complete ‘Conversions’ report on the canvas:
#7 Creating the ‘Ecommerce’ report.
Follow the steps below:
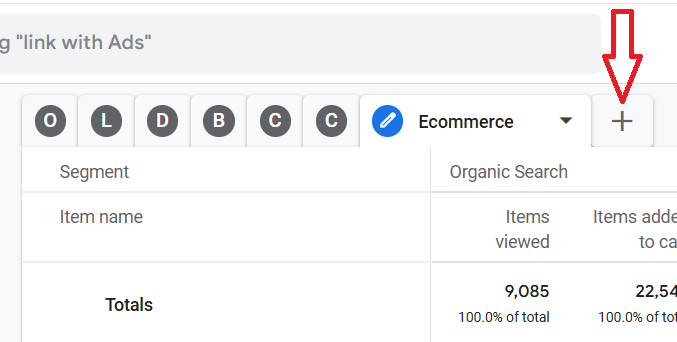
Step-1: Click on the + button next to the ‘Conversions’ tab:
Step-2: Click on ‘Free form’:
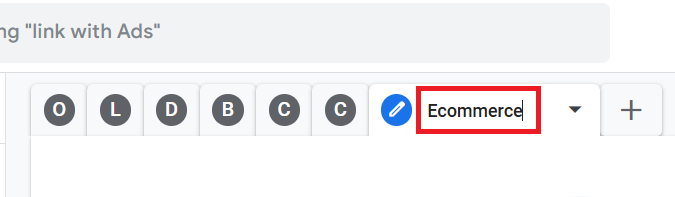
Step-3: Name the new tab ‘Ecommerce’:
Step-4: Double click on the ‘Organic Search’ segment to add it to the canvas:
Step-5: Double-click on the ‘Item name’ dimension to add it to the canvas on the right:
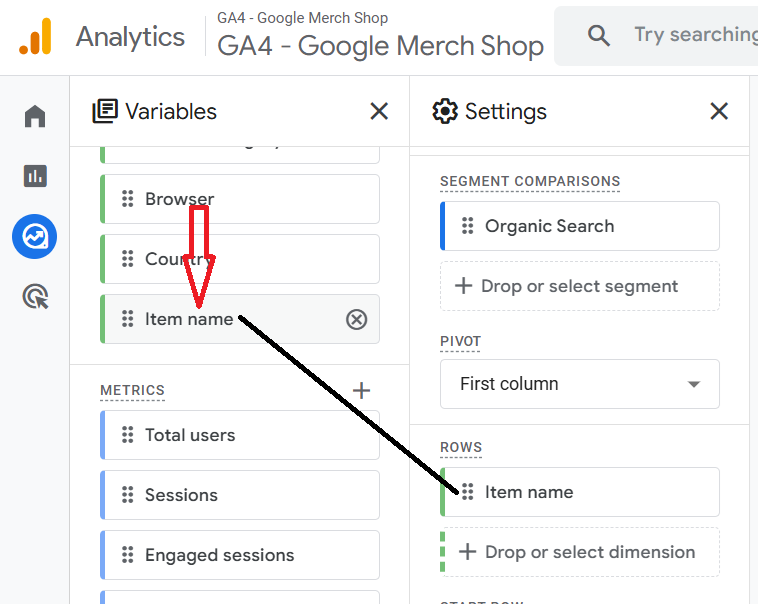
Step-6: Double click on the following metrics one by one in the exact order as mentioned below to add them to the canvas on the right:
- Items viewed.
- Items added to cart.
- Items purchased.
- Item revenue.
Step-7: Scroll down and select cell type to ‘Heat map’.
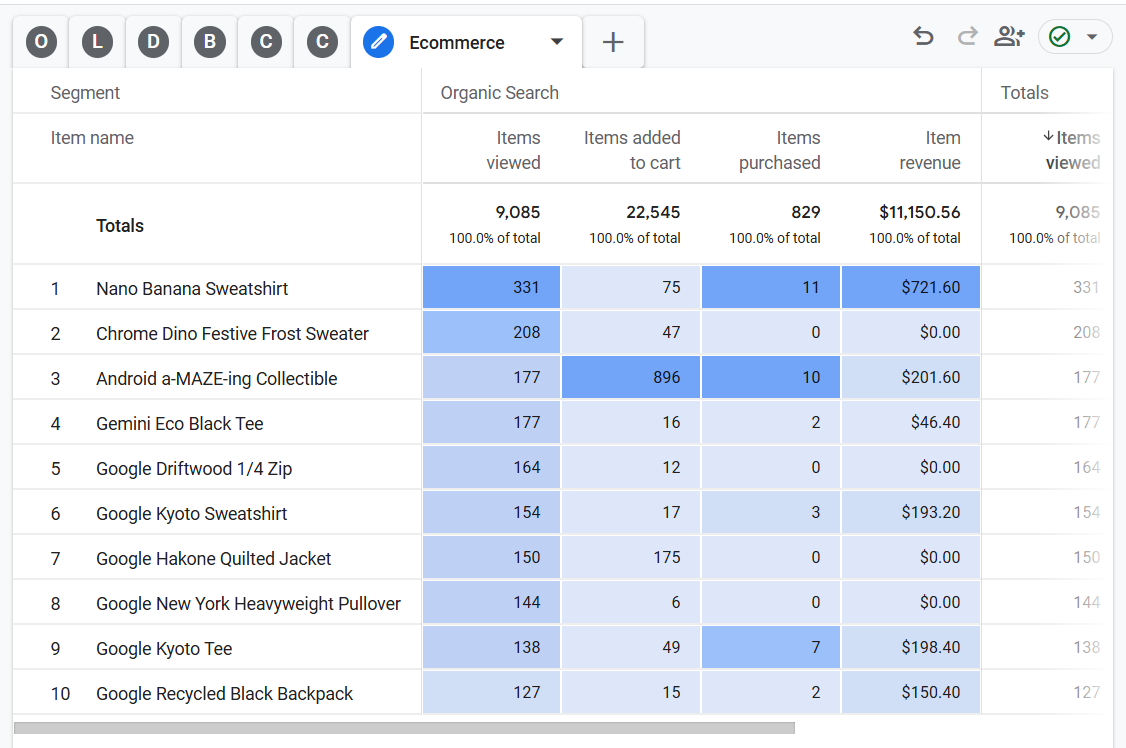
You should now be able to see the complete ‘Ecommerce’ report on the canvas:
#8 Creating the ‘User Flow’ report.
Follow the steps below:
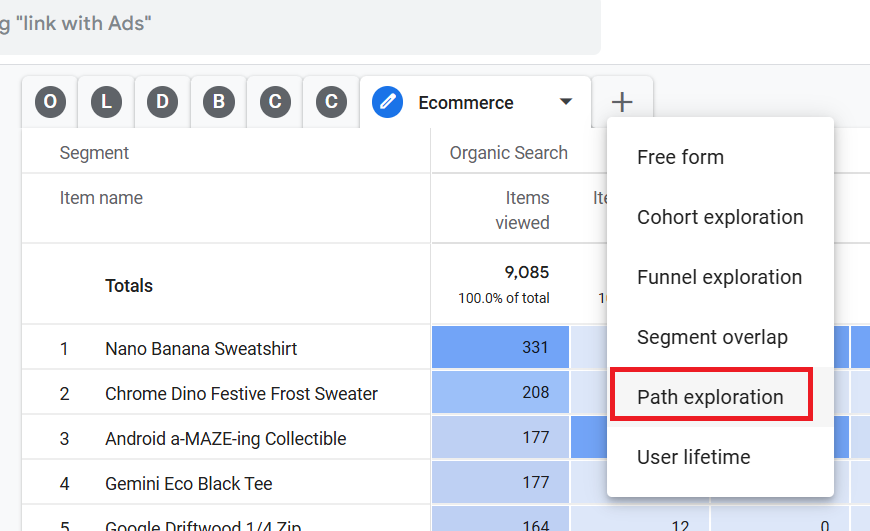
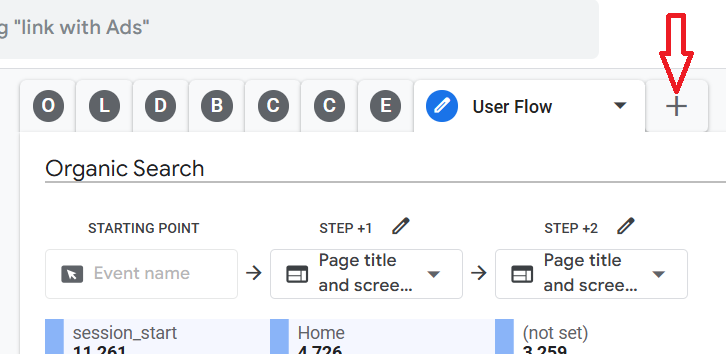
Step-1: Click on the + button next to the ‘Ecommerce’ tab:
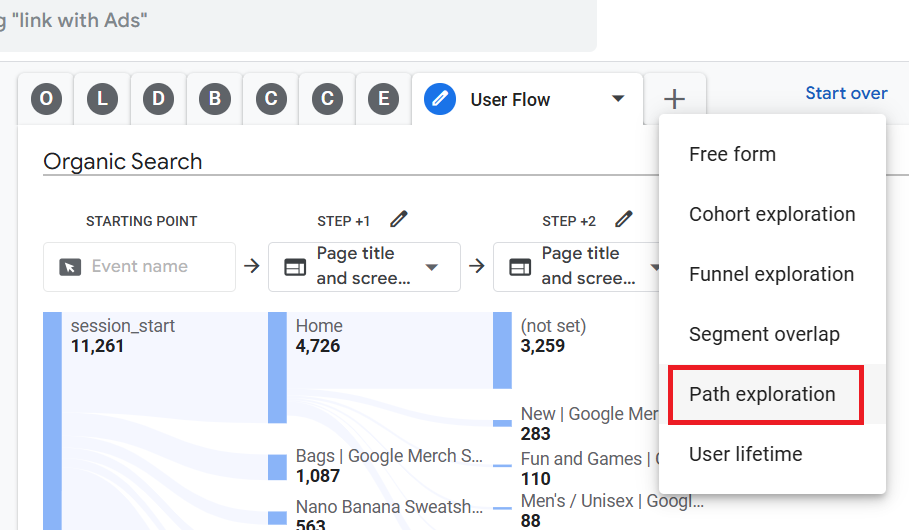
Step-2: Click on ‘Path Exploration’:
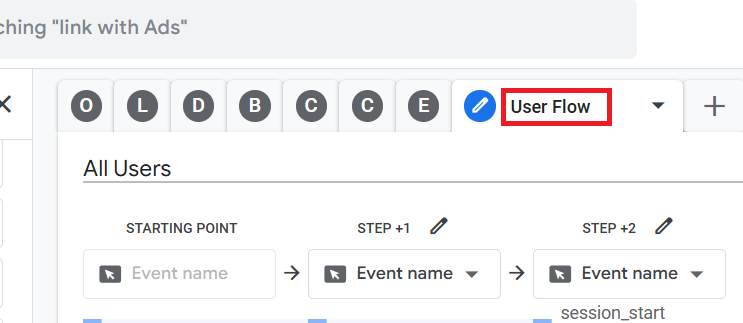
Step-3: Name the report ‘User Flow’:
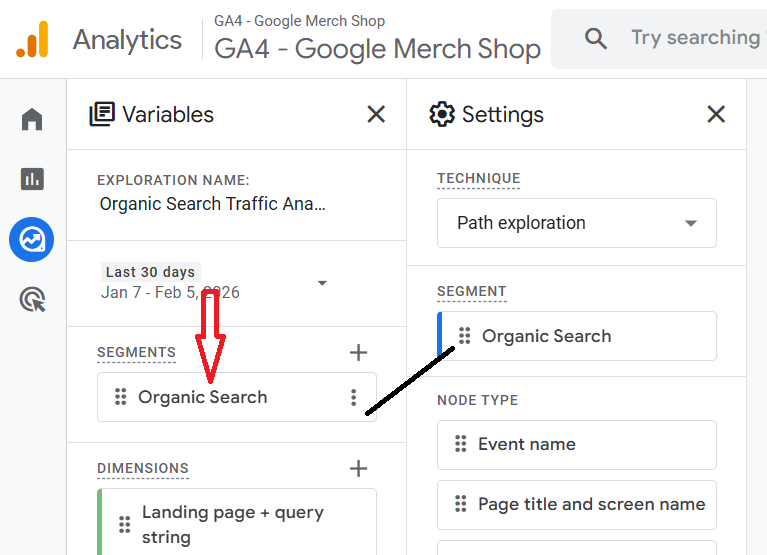
Step-4: Double click on the ‘Organic Search’ segment to apply it to the report:
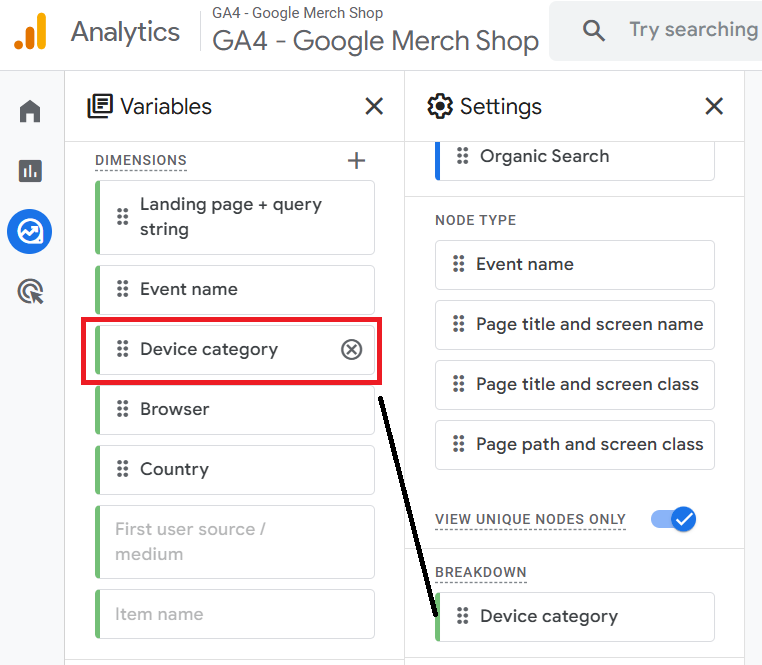
Step-5: Double-click on the ‘Device Category’ dimension to apply it as a breakdown dimension to the report:
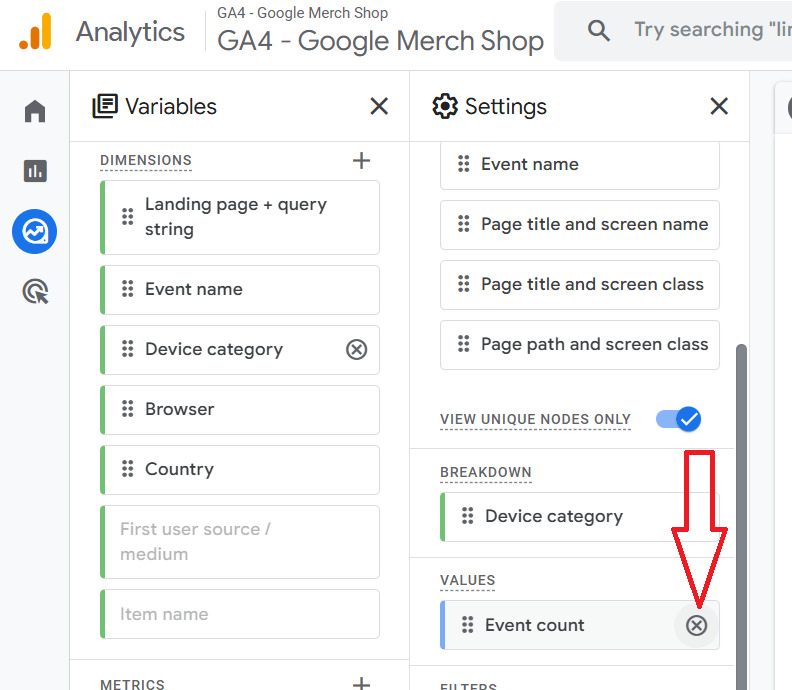
Step-6: Click on the cross button next to ‘Event Count’ to remove this metric from the report:
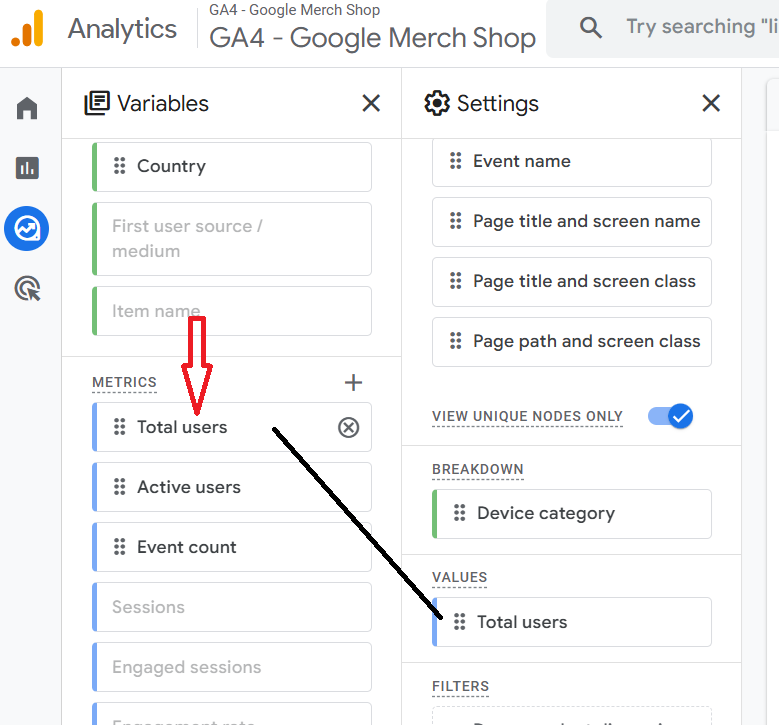
Step-7: Double click on the ‘Total users’ metric to apply it to your report:
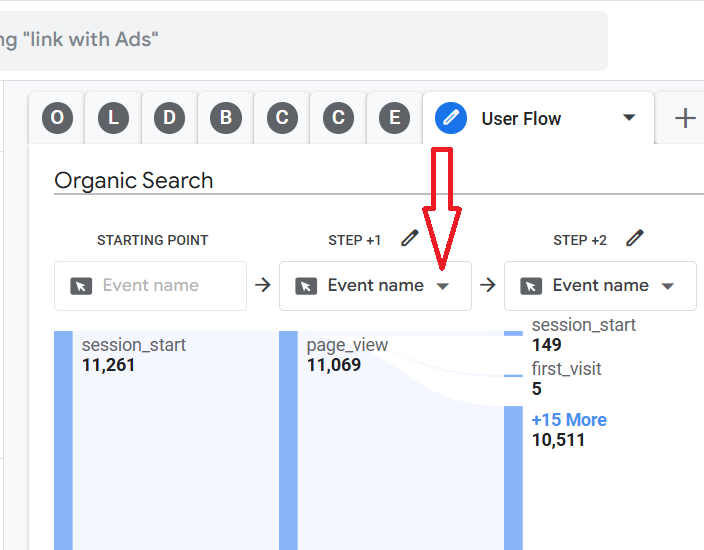
Step-8: Click on the drop-down menu under ‘STEP +1’:
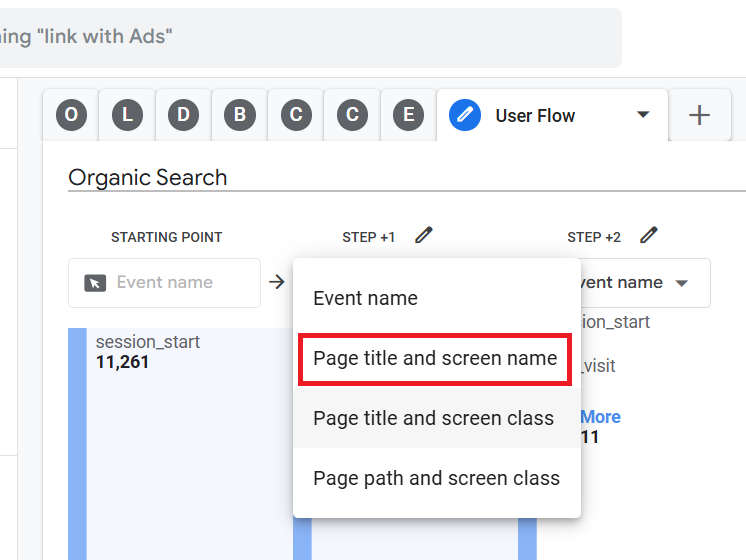
Step-9: Click on ‘Page title and screen name’:
You should now see a screen like the one below:
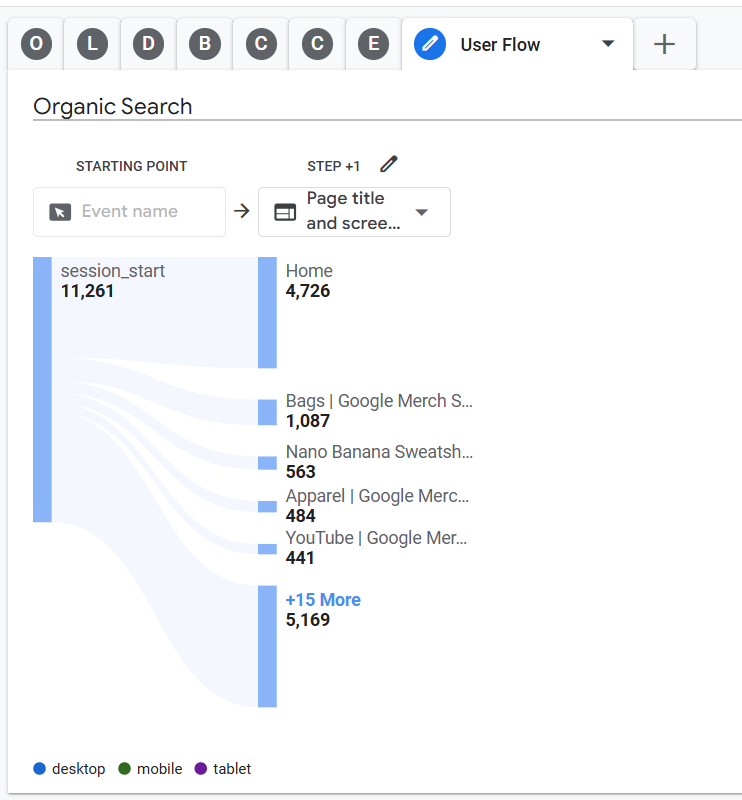
Step-10: Hover your mouse over a blue bar next to a page title (say ‘Home ’) to see the breakdown by device category:
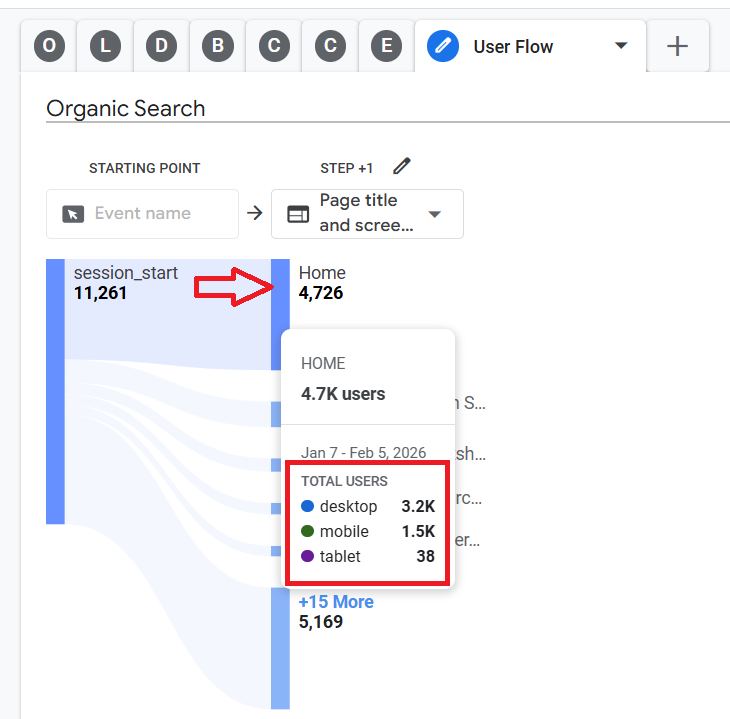
From the screenshot above, we can conclude the following:
- The ‘Home ’ page was visited by 4.7k users in the last 30 days.
- The majority of users came from Desktop (3.2k), followed by Mobile (1.5k) and tablet (38) devices.
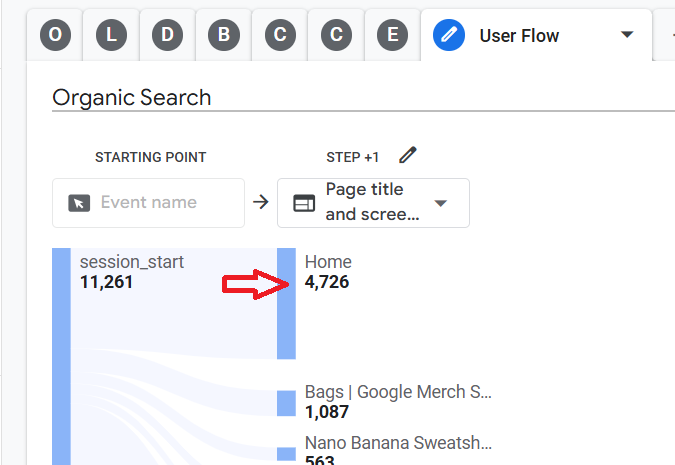
Step-11: Click on the blue bar next to the page title to see how the users navigated from that page. Let’s click on the blue bar next to ‘Home’.
Once you click on the blue bar, you should see another step added to the report, which shows the progression from the ‘Home’ page:
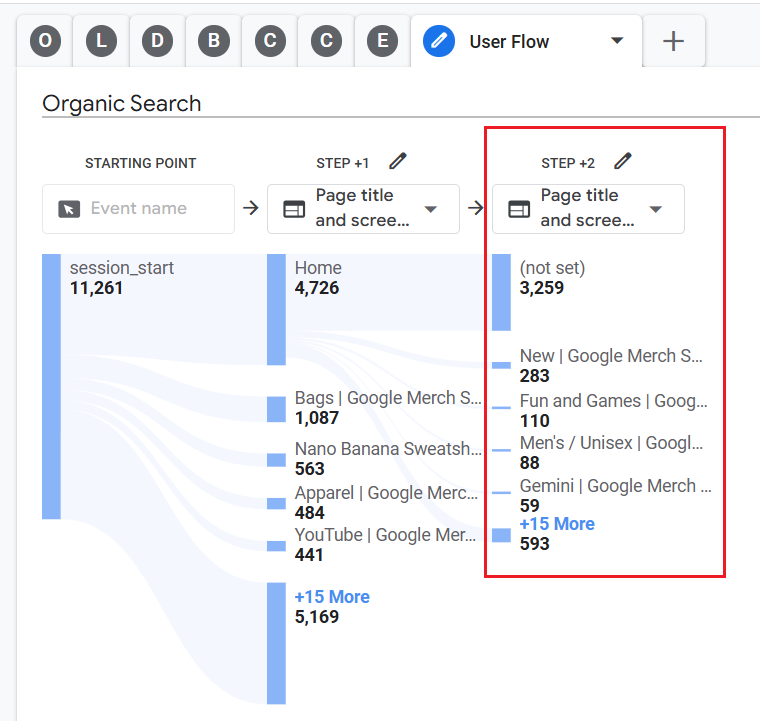
That’s how you can determine how the organic search traffic is using your website.
#9 Creating the ‘Funnel’ report.
Follow the steps below:
Step-1: Click on the + button next to the ‘User Flow’ tab:
Step-2: Click on ‘Path Exploration’:
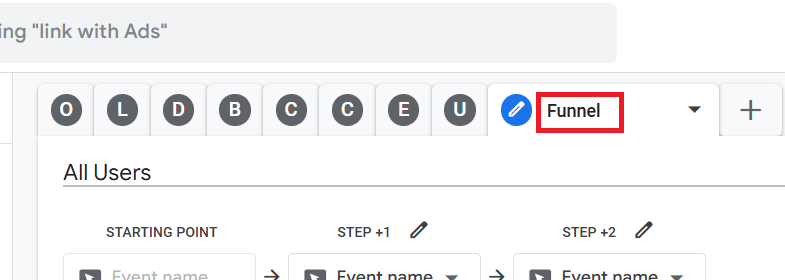
Step-3: Name the new tab ‘Funnel’:
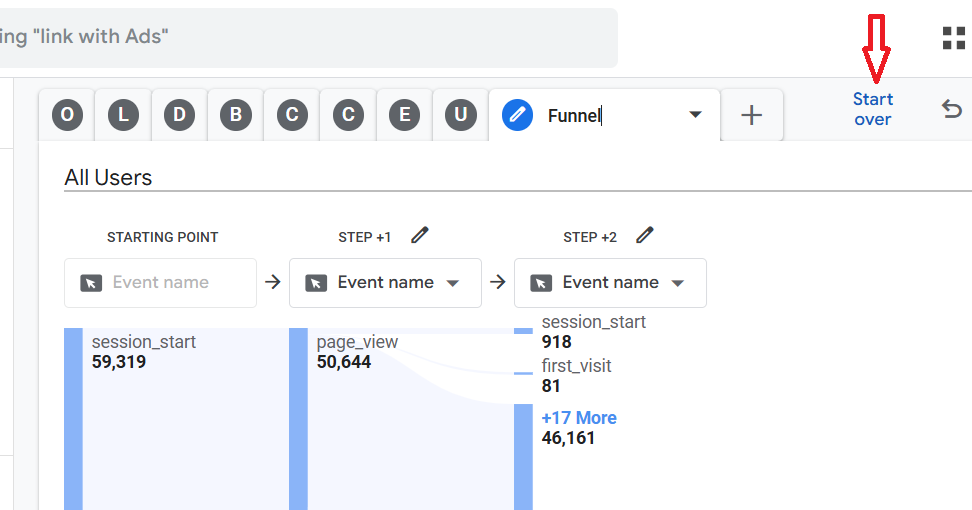
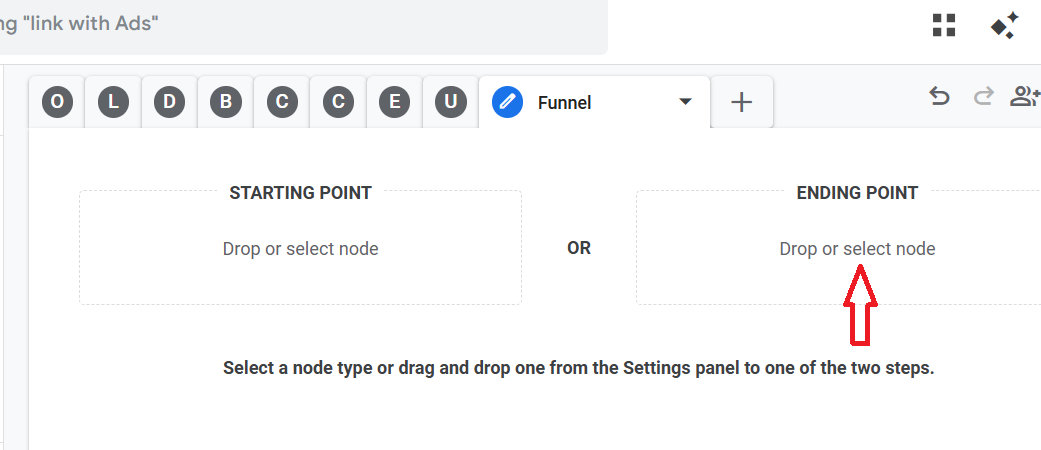
Step-4: Click on the ‘Start Over’ button located at the top right-hand side of the report:
Step-5: Click on ‘Drop or Select node’ under ‘ENDING POINT’:
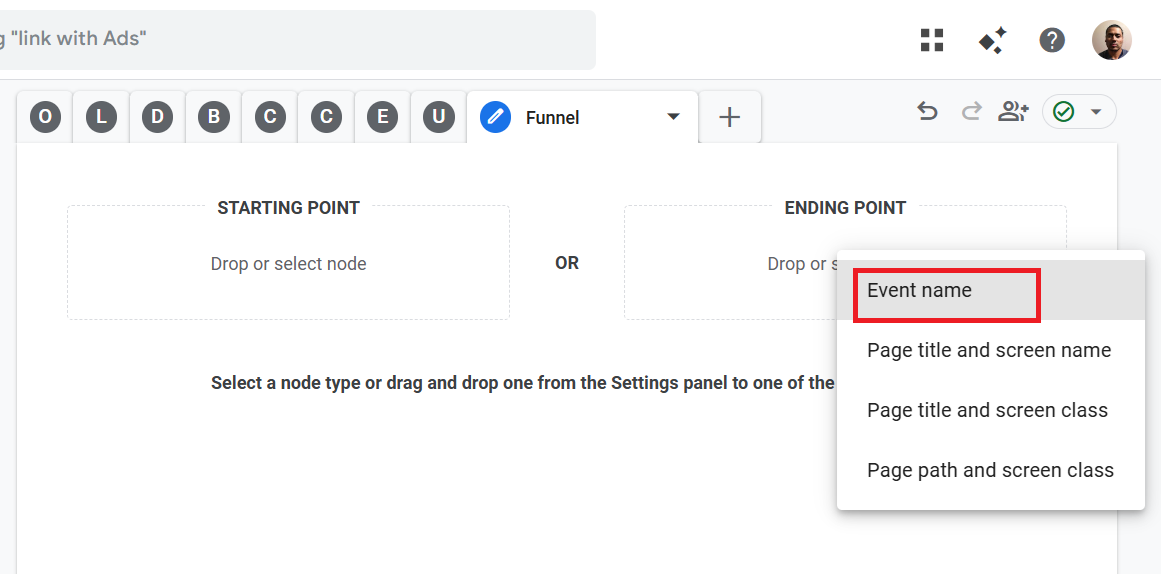
Step-6: Select ‘Event Name’ as the Ending Point from the drop-down menu:
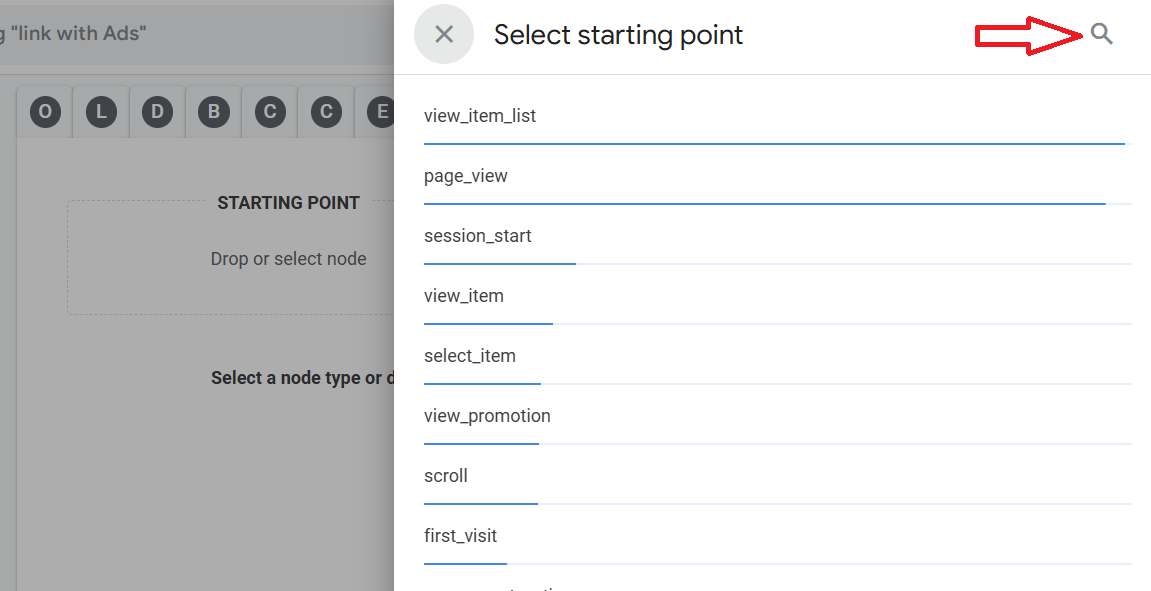
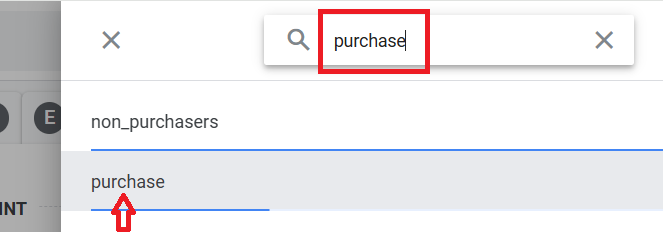
Step-7: Click on the magnifying glass and then search and select a conversion event like ‘Purchase’:
You should now see a screen like the one below:
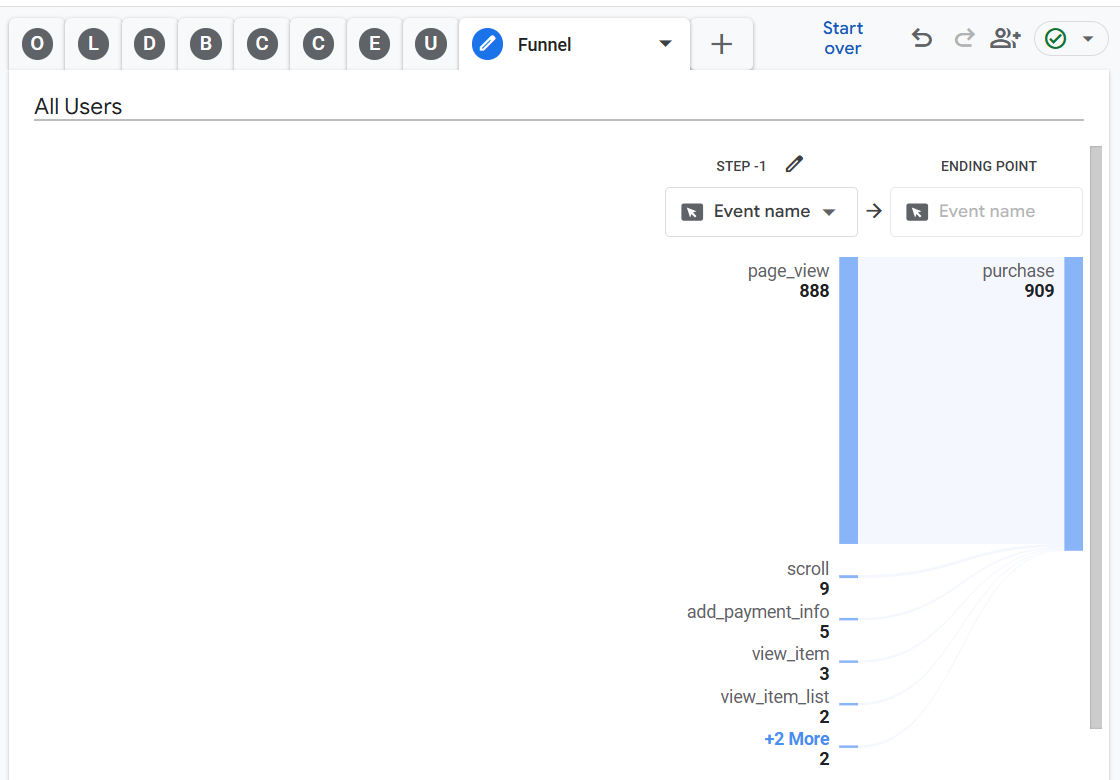
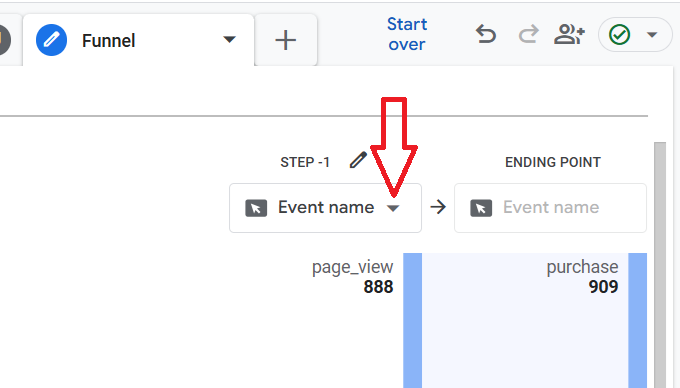
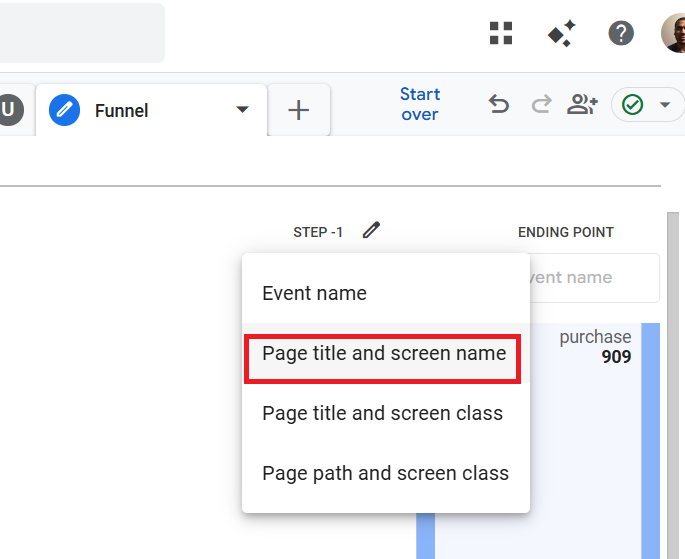
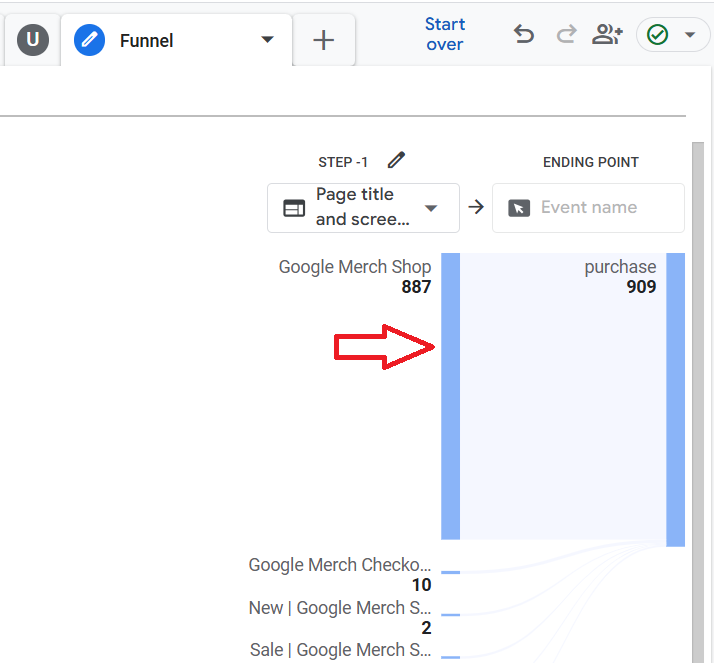
Step-8: Select ‘Page title and screen name’ from the drop-down menu under Step-1.
Step-9: Click on the blue bar under Step-1 to generate step-2:
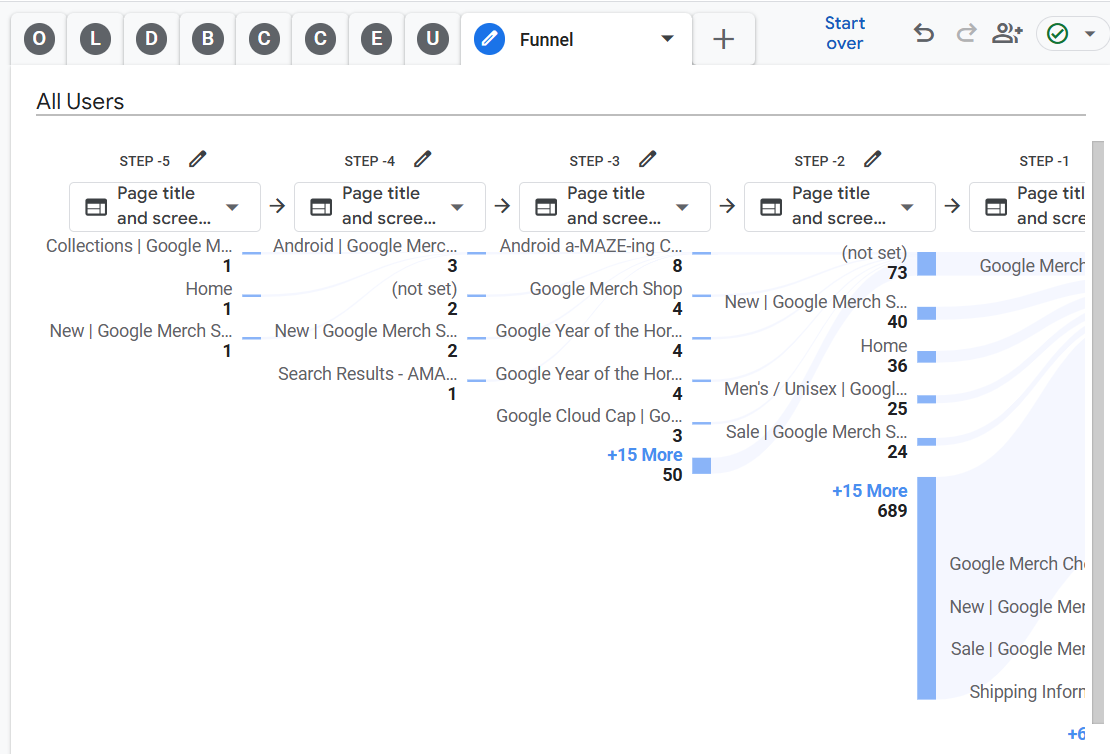
Step-10: Click on the blue bar under Step-2 to generate step-3 and so on:
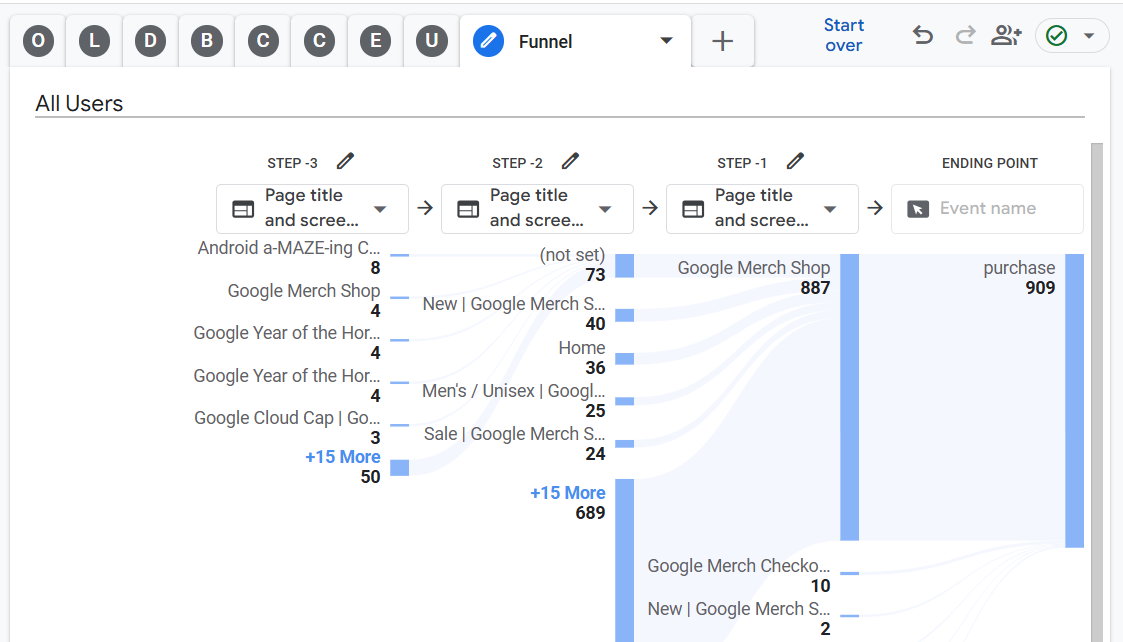
Your screen may eventually look like the one below:
Step-11: Double-click on the ‘Organic Search’ segment to apply it to the report.
Step-12: Double click on the ‘Device Category’ dimension to apply it as a breakdown dimension to the report.
Step-13: Click on the cross button next to ‘Event Count’ to remove this metric from the report.
Step-14: Double click on the ‘Total users’ metric to apply it to your report.
Your final report may look like the one below:
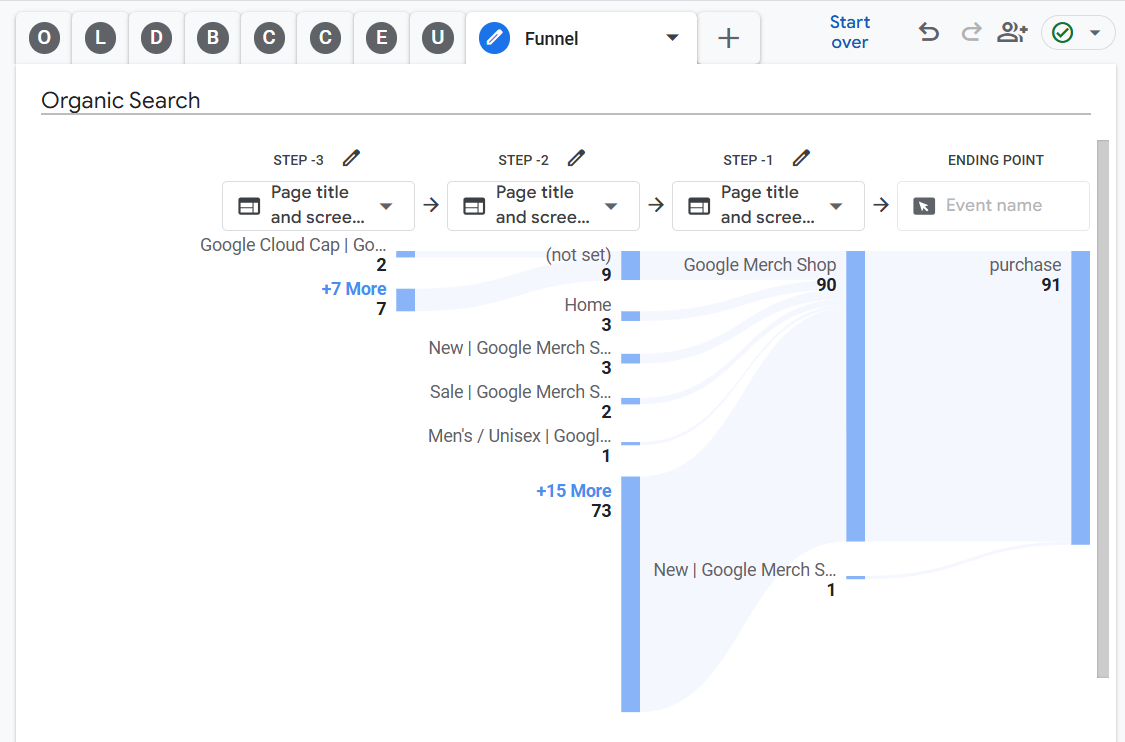
That’s how you can determine how the organic search traffic is converting on your website for a particular conversion.
Other Articles on GA4.
- Tracking New, Qualified and Converted Leads in GA4.
- Free GA4 training and tutorial with Certification.
- Understanding GA4 Ecommerce Reports (Monetization Reports).
- GA4 Ecommerce Tracking via GTM: Step-by-Step Setup Guide.
- How to see UTM parameters in GA4 (Google Analytics 4).
- GA4 UTM parameters not working? Here is how to fix it.
- How To Use UTM parameters in GA4 (Campaign Tracking).
- How to track AI traffic in GA4.
- Understanding Google Analytics 4 cookies – _ga cookie.
- GA4 (Google Analytics 4) Measurement Protocol Tutorial.
- GA4 Unassigned Traffic: Causes and How to Fix it Fast.
- GA4 Regex (Regular Expressions) Tutorial.
- GA4 Direct Traffic Spike: Common Causes and How to Fix Them.
- gtag.js – Google Tag in Google Analytics 4 and beyond.
- GA4 Scopes – User, Session, Event & Item scopes.
- GA4 Conversion Tracking (Key Events) Tutorial.
- GA4 (not set) - Guide to fixing (not set) issue.
- GA4 Certification Exam: Questions, Answers for Skillshop (GAIQ).
- GA4 User Properties (User Scoped Custom Dimensions) – Tutorial.
- Tracking Organic Traffic in GA4 - Complete Guide.
- Tracking Events in GA4 (Google Analytics 4).
- GTM Server Side Tagging - Setup Guide.
- Using Subfolder for GTM Server Side Tagging (Same Origin Tracking).
- Understanding Event Parameters in Google Analytics 4 (GA4).
- How to Uninstall GTM Server Side Tagging.
- How to remove (other) in GA4 reports and avoid Cardinality.
- Creating GA4 Assistant via Claude for your customers.
- How To Set Up User ID in GA4 - Cross Device Tracking.