

When using GA4 reports, you should avoid cardinality wherever possible. That’s how you can remove the (other) row from appearing in your reports.
 in GA4 reports and avoid Cardinality 1")
What is Cardinality?
Cardinality refers to the number of unique values in a data set.
A data set is a set of observed values for a particular variable.
For example,
Consider the following data set: {20, 10}
This dataset has two unique values: 20 and 10. Therefore, the cardinality of this data set is two.
Consider the following data set: {20, 10, 10}
This dataset has two unique values: 20 and 10. Therefore, the cardinality of this data set is two.
Similarly,
Consider the following data set: {20, 10, 6, 8}
This data set has four unique values. Therefore, the cardinality of this data set is four.
A dataset with many unique values is called a high-cardinality dataset.
Types of GA4 cardinality.
In the context of GA4, there are three types of cardinality:
- The cardinality of a dimension.
- The cardinality of a data table.
- The cardinality of the underlying data table.

What is the Cardinality of a GA4 dimension?
Google defines the cardinality of a GA4 dimension as the total number of unique values assigned to the dimension.
For example, the dimension ‘Age’ can have the following unique values:
- unknown
- 25-34
- 18-24
- 35-44
- 45-54
- 55-64
- 65+
 in GA4 reports and avoid Cardinality 2")
Since the dimension ‘Age’ has 7 unique values, the cardinality of the ‘Age’ dimension is 7.
Consider another dimension, ‘Gender’.
This dimension can have the following unique values:
- unknown
- male
- female
 in GA4 reports and avoid Cardinality 3")
Since the dimension ‘Gender’ has 3 unique values, the cardinality of the ‘Gender’ dimension is 3.
Consider another dimension, ‘Item name’.
This dimension can have hundreds or even thousands of unique values:
 in GA4 reports and avoid Cardinality 4")
Suppose the dimension ‘Item name’ has 2000 unique values. Then its cardinality will be 2000.
Google defines high-cardinality dimensions as those with more than 500 unique values in a day.
So if GA4 reports more than 500 unique values for the ‘Item name’ dimension in one day, then it would be considered a high cardinality dimension.
Types of data tables in GA4.
 in GA4 reports and avoid Cardinality 5")
There are three types of data tables in GA4.
#1 One is the data table that you see in the reports via the GA4 user interface or via the data API.
#2 The second one is the corresponding underlying data table that you can’t see. This data table contains processed/aggregated data rather than the raw event and user-level data.
Whenever you query data via the GA4 user interface or via the data API, GA4 pulls data from the underlying data tables.
Note: Many other dimensions that are not part of the report can also use the same underlying data tables.
#3 The third type of data table contains raw event and user-level data. You can access such types of data tables via the exploration reports or via BigQuery.
What is the Cardinality of a GA4 data table?
The cardinality of the data table that you see in a report via the GA4 user interface or data API is the total number of rows reported for the data table.
So, if you see a data table with 200 rows, its cardinality would be 200.
The cardinality of the GA4 data table increases as you apply more dimensions to the report.
Let us suppose you have a data table that contains the following two dimensions: Age and Gender:
 in GA4 reports and avoid Cardinality 6")
The cardinality of the ‘Age’ dimension is 7, and that of the ‘Gender’ dimension is 3.
So when you apply both of these dimensions to your report, the cardinality of the data table could be up to 7*3 = 21.
So you can see up to 21 rows in your data table.
What is the Cardinality of an underlying GA4 data table?
The cardinality of an underlying data table is the total number of rows that will be processed to produce the data table you can see in reports via the user interface or data API.
GA4 has an unspecified limit on the number of rows it processes to generate your data table. This row limit has been set to reduce data processing costs.
It is important to remember that the number of rows that will be processed to produce a data table could be greatly different from the number of rows actually present in your data table.
For example, there could be a case where the data table has a cardinality of 20, but its corresponding underlying data table has a row limit of 7.
In that case, the resulting data table will include only 14 rows (20-7+1), and one row will include the (other) category that groups the data from the remaining 7 rows.
There could be a case where the underlying data table has to process dimensions that are not part of the report you see. Such dimensions can also contribute to the cardinality limit.
And if these dimensions are high cardinality dimensions, it could affect the cardinality limit of the underlying data tables throughout your GA4 property.
So even one high cardinality dimension can negatively affect the cardinality limit of most of the data you see in your GA4 property.
Because of these reasons, you could hit the row limit even when you are using low cardinality dimensions in your data table.
So it is possible to see (other) in your standard reports even when you are using a low cardinality dimension.
Note: You can increase the row limit of underlying data tables by expanding the data set or by directly accessing the raw event and user-level data via the exploration reports or BigQuery.
What are high cardinality data tables?
Google defines high cardinality data tables as tables with an unspecified number of rows.
In other words, Google has no official definition of what is considered a high cardinality data table.
Why is cardinality an issue in GA4 reporting?
GA4 does not have a cardinality limit on an individual dimension. You can have dimensions with any number of unique values.
GA4 does not have a cardinality limit on the data tables. You can have a data table with any number of rows.
However, GA4 imposes an unspecified cardinality limit on the underlying data tables accessed via the GA4 user interface or the GA data API.
This cardinality/row limit has been imposed to reduce data processing costs.
When you use a high cardinality dimension or multiple dimensions, it increases the number of rows that are processed for a data table.
And when the underlying data table hits the unspecified row limit, any data past the row limit is reported under the (other) row/category:
 in GA4 reports and avoid Cardinality 7")
Standard and exploration reports can have different unspecified row limits for the same data table.
What that means is when you re-produce the data table used in a standard report via the exploration report template, you could end up seeing very different top 10 rows in the data tables.
This is especially true if the standard report contains the (other) row.
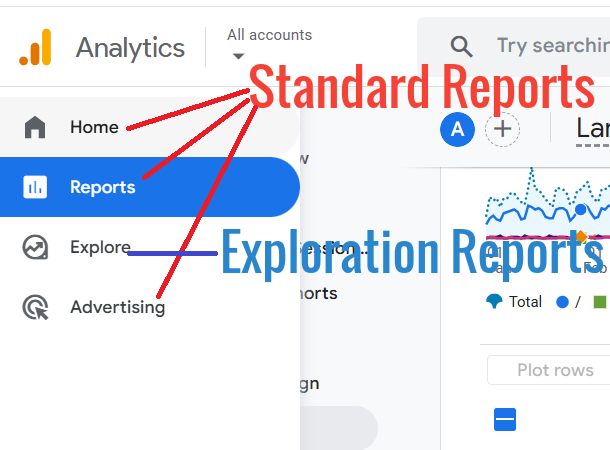
Where can you find the (other) row in GA4?
You can see the (other) row in any standard report found in the GA4 user interface. You can see (other) in your reports even if you are using the Google Analytics Data API.
Through the data API, you can programmatically access the GA4 report data.
The data API is used to create reports, custom dashboards, automate complex reporting tasks and send GA4 data to other data platforms.
You can also see (other) in Looker Studio reports if you are using the native GA4 connector.
Where won’t you find (other) in GA4?
Standard GA4 reports with one dimension usually do not contain the (other) row in their data table.
It is usually when you apply secondary dimensions, filters or comparisons the (other) row can appear in the data table:
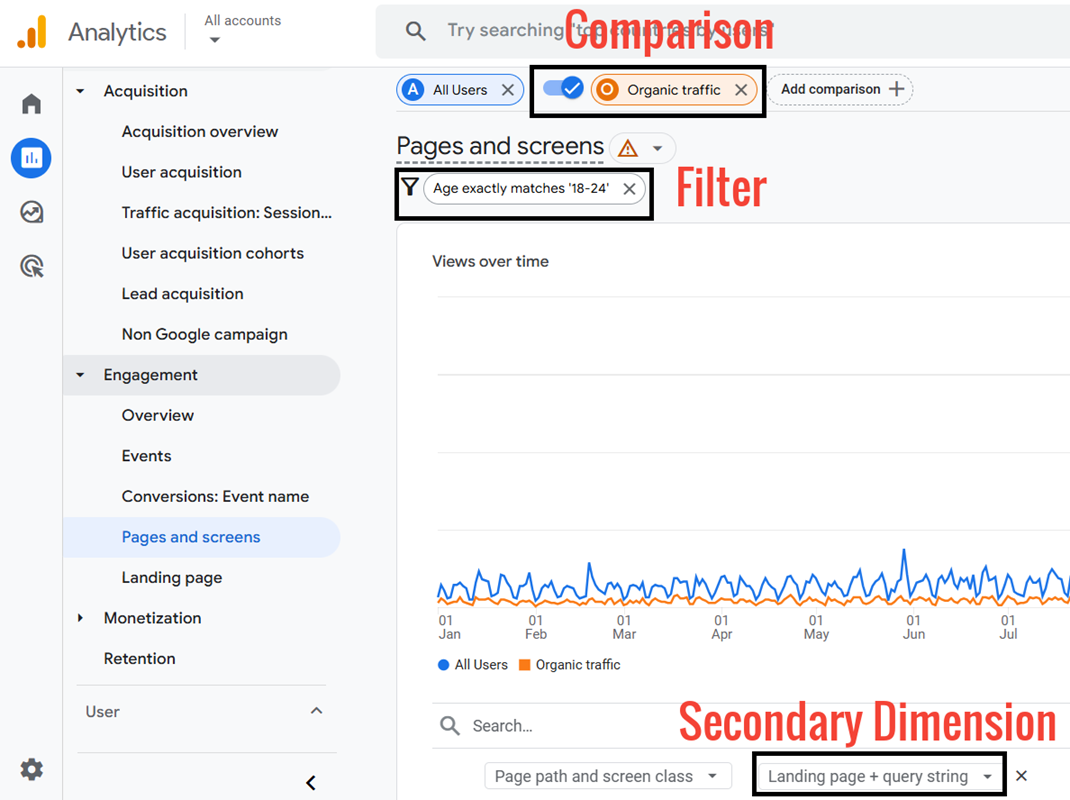
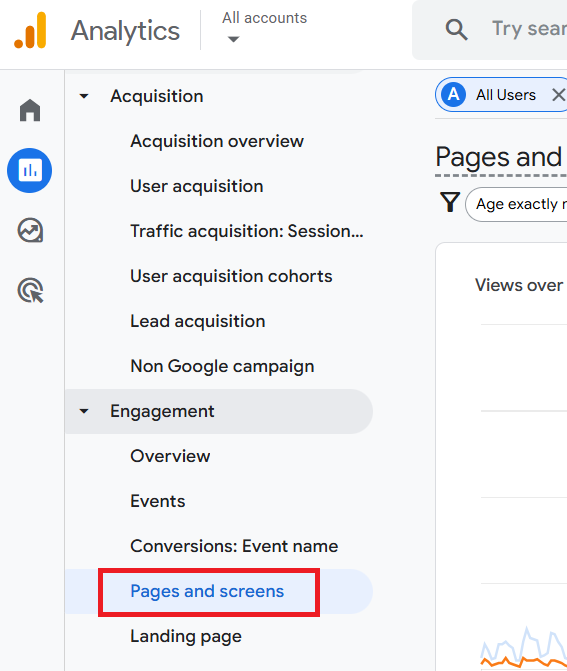
Some standard GA4 reports (like the ‘Pages and Screens’ report) have high cardinality dimensions:
Such reports have a high cardinality limit on the underlying data tables. Thus, greatly reduces the possibility of seeing the (other) row in a data table.
You will not see (other) in an exploration report in GA4 because exploration reports have access to the raw event and user-level data.
However, exploration reports are subject to data sampling.
You will also not see (other) in GA4 BigQuery export data tables, as these tables have access to the raw event and user-level data.
And unlike exploration reports, they are also not subject to data sampling.
How to remove (other) in GA4 reports?
Use the following methods to remove the (other) row in your GA4 reports:
- Exclude all unwanted URL query parameters in GA4
- Avoid high cardinality dimensions.
- Use pre-defined dimensions wherever possible.
- Avoid creating complex reports.
- Use GA4 360 to minimize cardinality.
- Export GA4 data to BigQuery.
- Create an exploration report.
- Use expanded data sets.
- Avoid data sampling.
#1 Exclude all unwanted URL query parameters in GA4.
Exclude all unwanted URL query parameters in GA4. This will greatly reduce the cardinality of the dimensions related to page tracking.
You can reduce the impact of ‘(Other)’ in GA4 Reporting by removing all the unwanted query parameters from your page path before you send the page tracking data to GA4.
Note: I do not recommend excluding the following parameters from your GA reports:
- Search query parameters.
- gclid, gclsrc, dclid, gclsrc, srsltid.
- UTM parameters (utm_source, utm_content, utm_id, utm_medium, utm_campaign, utm_term, utm_id, utm_source_platform etc).
#2 Avoid high cardinality dimensions.
Avoid using high cardinality dimensions in your GA4 reports.
Avoid creating high cardinality custom dimensions in GA4. You can do this by avoiding custom events with many distinct values.
For example, a custom dimension that reports on user IDs or client IDs can easily become a high cardinality dimension and introduce (other) rows in most of your data tables.
#3 Use pre-defined dimensions wherever possible.
Create a custom dimension only when its equivalent predefined dimension is unavailable.
Similarly,
Before you create a custom event, ensure there is no automatic, enhanced measurement or recommended event that already provides what you need.
#4 Avoid creating complex reports.
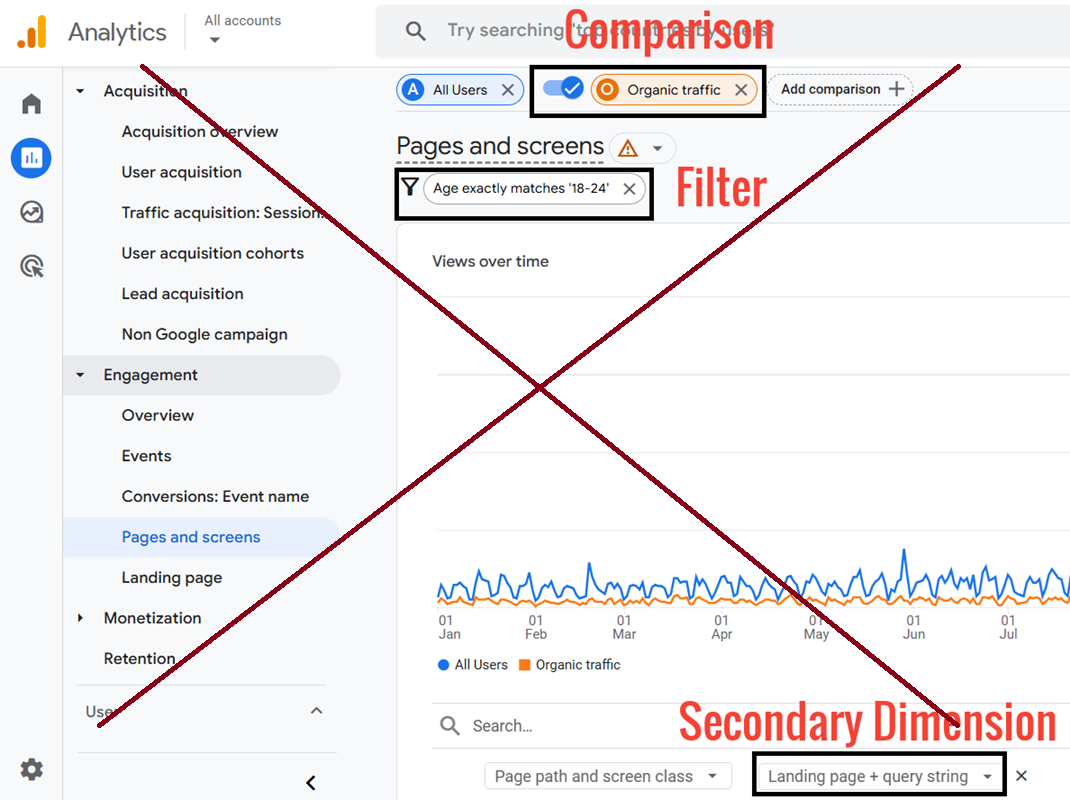
Avoid applying secondary dimensions, filters, or comparisons to reports created via the GA4 user interface or the data API.
This is because complex reports can easily increase the cardinality of the data table, and you are more likely to see the (other) row.
If you want to create complex reports, use the exploration report templates or first prepare the data using BigQuery.
#5 Use GA4 360 to minimise cardinality.
If you run a very high-traffic website (millions of events per week/month) or own a very big website (tens of thousands of web pages), you should seriously consider using GA4 360 property.
This is because the GA4 360 property comes with much higher cardinality and data sampling limits than the standard GA4 property.
Thus, greatly reduces the possibility of seeing the (other) row in a data table.
#6 Export GA4 data to BigQuery.
If you run a high-traffic website or website with thousands of pages but can’t afford GA4 360, then you are unlikely to be able to remove (other) in GA4 reporting without using BigQuery.
GA4 BigQuery export data tables do not suffer from cardinality or data sampling issues.
Note: GA4 BigQuery data tables do not include Google Signals data. If you want to use the Google Signals data, use the GA data API or the GA4 user interface.
#7 Create an exploration report.
If a standard report contains the (other) row, then reproduce the report by using an exploration report template.
The (other) category never appears in exploration reports because they access raw, event-level data.
Whenever you see a standard report that contains the (other) row, click on the data quality icon at the top of the report:
 in GA4 reports and avoid Cardinality 12")
Then click on the link ‘Create an exploration’ to create a new exploration report based on the standard report:
 in GA4 reports and avoid Cardinality 13")
Note: Exploration reports are not subject to (other) rows but can be subject to data sampling. On the other hand, GA4 standard reports and GA data API are not subject to data sampling, but they can be subject to (other) rows.
#8 Use expanded data sets.
If you use GA4 360 property, then you should see another option called ‘Expand this data’ when you click on the data quality icon on a report which contains the (other) row:
 in GA4 reports and avoid Cardinality 14")
Note: The ‘Expand this data’ option appears only for eligible reports that include the ‘(other)’ row. You won’t see the option for every report.
User-generated expanded data set.
When you click on the ‘Expand this data’ link, GA4 360 will expand the (other) row in your report to up to 2 million rows of data.
This feature of GA4 360 is called the User-generated expanded data set.
Note: The expanded data can take up to 48 hours to appear in your report. So you can’t see the expanded data immediately.
Automatic expanded data set.
By default, GA4 360 automatically enables the expanded data set when you frequently view a report which contains the (other) row.
This feature of GA4 360 is called the Automatic Expanded Dataset.
You don’t need to take an action to use the automatic expanded data sets feature of GA4 360.
However, if you don’t want to wait for the automatic expanded data set to get enabled, then you can manually expand the data set by using the User-generated expanded data set feature.
#9 Avoid data sampling.
The reports created via the GA4 user interface or data API are not subject to data sampling.
But when GA4 samples the data badly, it can introduce the (other) rows in your data tables.
The exploration reports are not subject to (other) rows but can be subject to data sampling.
So when GA4 samples data poorly, it can skew the results in the exploration reports.
Avoid creating or using high-cardinality dimensions in your reports, as they can introduce data sampling.
If you run a high-traffic or large website, then use GA4 360 to minimise or eliminate data sampling.
If that is not possible, track different sections of your website under separate properties.
Note: The data sampling limit for the standard GA4 property is 10 million events. Whereas for GA4 360 property, the sampling limit is 1 billion events.
Limitations of the expanded data sets
The following are some of the limitations of the expanded data sets feature that you must be aware of:
#1 Expanded data sets are available only to GA4 360 users.
 in GA4 reports and avoid Cardinality 15")
#2 If the expanded data you requested still exceeds 2 million rows, your report can still include the (other) row.
#3 The expanded data can take up to 48 hours to appear in your report. So you can’t see the expanded data immediately.
#4 GA4 360 disables the ‘automatic expanded data sets’ feature of a report when no property user views the report in the last 60 days, at which point the data will condense back into the (other) row.
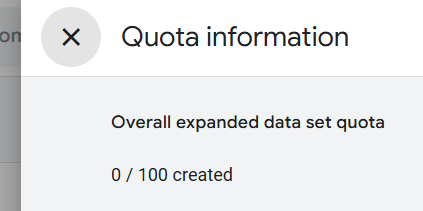
#5 You can create a maximum of 100 expanded data sets per GA4 360 property. In other words, you can flag up to 100 reports per property for expanded data.
#6 The expanded data is not available if your report contains more than 6 dimensions or 12 metrics. This includes dimensions that are used in filters and comparisons.
#7 The expanded data is unavailable if your report contains a filter with an OR clause.
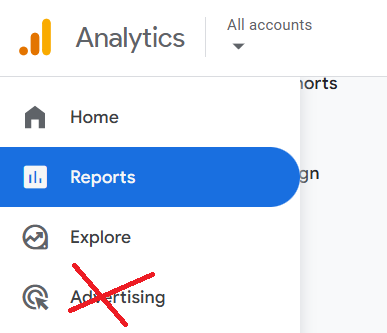
#8 The expanded data feature is currently available only for the reports in the ‘Reports’ tab that include a data table.
This feature is currently not available for advertising reports.
#9 The ‘expanded data sets’ feature is not available when you view a report which includes one of the following dimensions:
- Attribution dimensions.
- Channel grouping dimensions.
Important points to consider when using expanded data sets.
#1 Google recommends using the ‘expanded data set’ feature only when you need detailed data in a report for ongoing reporting. For one-off reporting, Google recommends that you use unsampled explorations.
 in GA4 reports and avoid Cardinality 18")
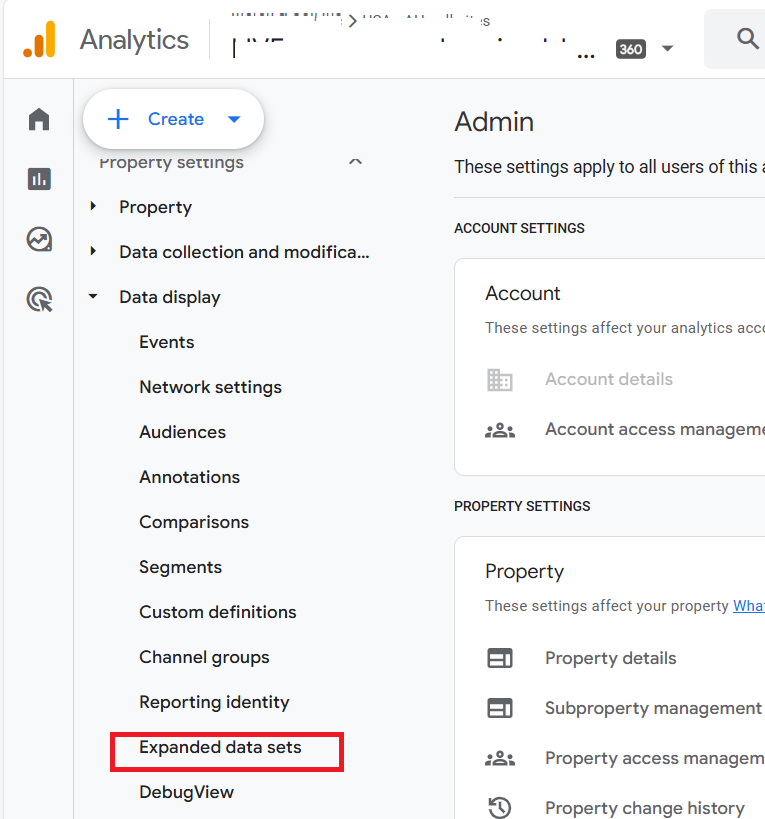
#2 You can see and manage the list of expanded data sets for your GA4 360 property by navigating to the ‘admin’ section and then clicking on the ‘Expanded Data Sets’ link under ‘Data display’:
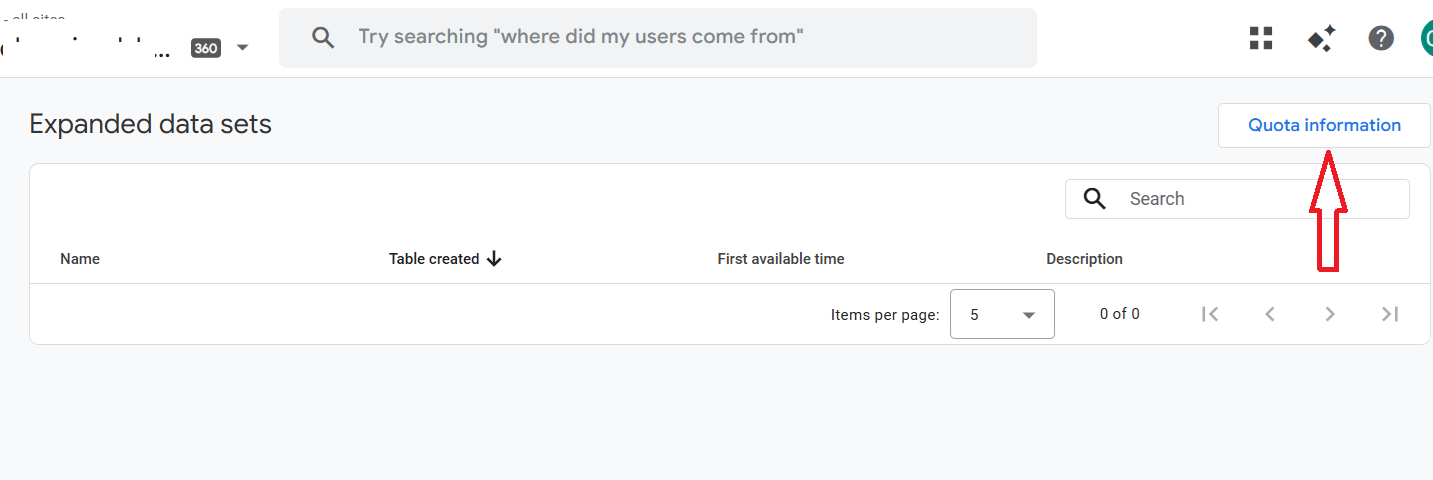
#3 If you want to see how many expanded data sets are still available to you, then click on the ‘Quota information’ button at the top of the table:
#4 You have the option to delete any expanded data sets that include the dimension you have archived.
Other Articles on GA4.
- Tracking New, Qualified and Converted Leads in GA4.
- Free GA4 training and tutorial with Certification.
- Understanding GA4 Ecommerce Reports (Monetization Reports).
- GA4 Ecommerce Tracking via GTM: Step-by-Step Setup Guide.
- How to see UTM parameters in GA4 (Google Analytics 4).
- GA4 UTM parameters not working? Here is how to fix it.
- How To Use UTM parameters in GA4 (Campaign Tracking).
- How to track AI traffic in GA4.
- Understanding Google Analytics 4 cookies – _ga cookie.
- GA4 (Google Analytics 4) Measurement Protocol Tutorial.
- GA4 Unassigned Traffic: Causes and How to Fix it Fast.
- GA4 Regex (Regular Expressions) Tutorial.
- GA4 Direct Traffic Spike: Common Causes and How to Fix Them.
- gtag.js – Google Tag in Google Analytics 4 and beyond.
- GA4 Scopes – User, Session, Event & Item scopes.
- GA4 Conversion Tracking (Key Events) Tutorial.
- GA4 (not set) - Guide to fixing (not set) issue.
- GA4 Certification Exam: Questions, Answers for Skillshop (GAIQ).
- GA4 User Properties (User Scoped Custom Dimensions) – Tutorial.
- Tracking Organic Traffic in GA4 - Complete Guide.
- Tracking Events in GA4 (Google Analytics 4).
- GTM Server Side Tagging - Setup Guide.
- Using Subfolder for GTM Server Side Tagging (Same Origin Tracking).
- Understanding Event Parameters in Google Analytics 4 (GA4).
- How to Uninstall GTM Server Side Tagging.
- How to remove (other) in GA4 reports and avoid Cardinality.
- Creating GA4 Assistant via Claude for your customers.
- How To Set Up User ID in GA4 - Cross Device Tracking.
- GA4 Mobile App Tracking - Firebase Integration.
- How to use DebugView report in Google Analytics 4 (GA4).
- How to Track Phone Calls in Google Analytics 4.
- How to detect GTM Server Side Tagging.