What is DebugView report in Google Analytics 4?
This report allows you to monitor debugging events from your website or mobile app in real time, along with all the custom parameters and user properties set.
When you navigate to the DebugView report for the first time in a day, you are unlikely to see any data there.
This is because this report displays only incoming debugging events (i.e., events that contain a debug mode parameter).
How to use the DebugView report?
To use the DebugView report, you need to first enable the debug mode for your personal device (web or app).
You can enable the debug mode for your web device by using the GTM preview mode (recommended) or by enabling the ‘Google Analytics Debugger’ Chrome extension.
To enable debug mode for your IOS APP, use the following command line argument in Xcode: –FIRDebugEnabled
To enable debug mode for your Android APP, use the following command: adb shell setprop debug.firebase.analytics.app PACKAGE_NAME
Note(1): You can also enable debug mode for all user devices by setting ‘debug_mode’ configuration parameter to ‘true’ in your Google Tag (not recommended).
Note(2): If you’ve set up client-side privacy measures (like Cookie consent banners, Do Not Track headers, Ad blockers, etc.) or enabled consent mode and users haven’t approved Analytics cookies, events might not appear in the debugview report.

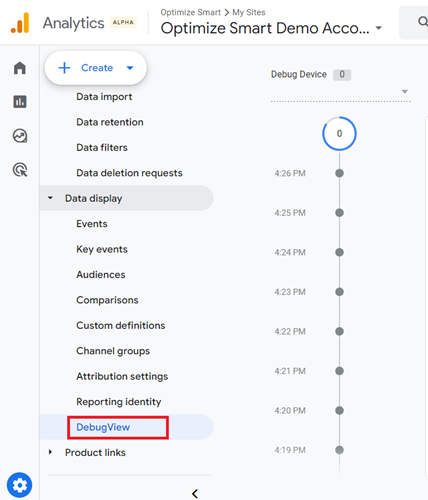
Once you have enabled the debug mode on your personal device, navigate to the admin section of your GA4 property and then click on the link ‘DebugView’ under the ‘Data display’ menu:
Start using your website or app and monitor debugging events as they fire.
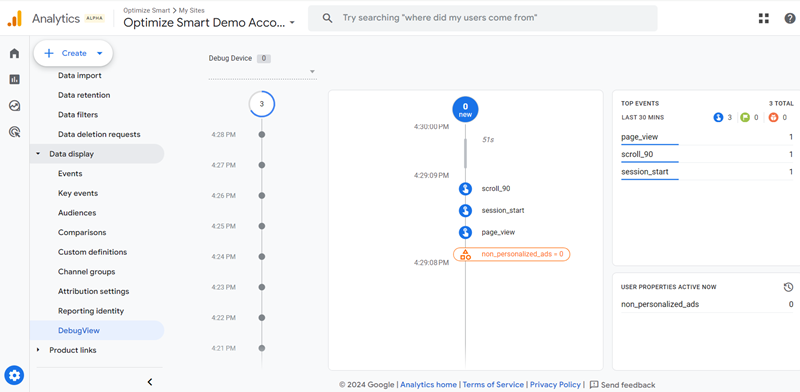
Components of the DebugView report.
The debugView report is made up of the following components/sections:
- Device Selector.
- Minutes Stream.
- Seconds Stream.
- Top Events.
- User Properties.
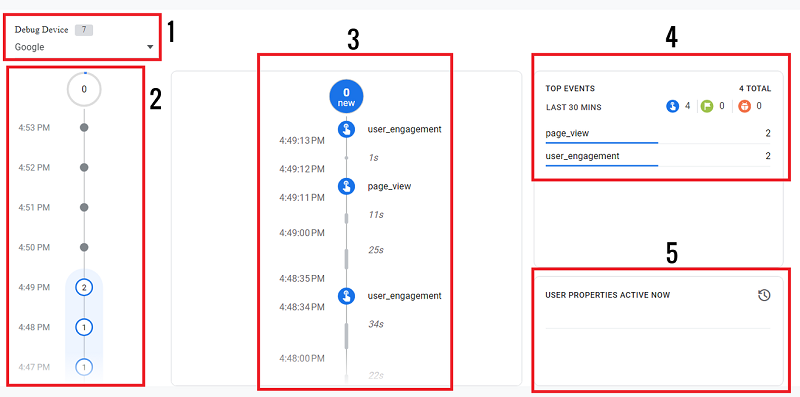
#1 Device Selector – In GA4, when you are debugging data sent from a mobile app, you need to select the appropriate device from the ‘Debug Device’ drop-down menu in the DebugView report to filter the data being sent from that specific device, whether it’s an Apple (iOS) or Google (Android) device.
Ideally, you don’t need to select a debug device when debugging web data. But I have noticed that you can’t always see your web data unless you select a debug device (preferably ‘Google’).
#2 Minutes Stream – This stream shows the events logged in the last 30 minutes in the form of a series of circles. One circle is shown next to each minute.
If you see a circle with a number, it means the events were recorded during that minute. The number in the circle denotes the count of events recorded during the minute.
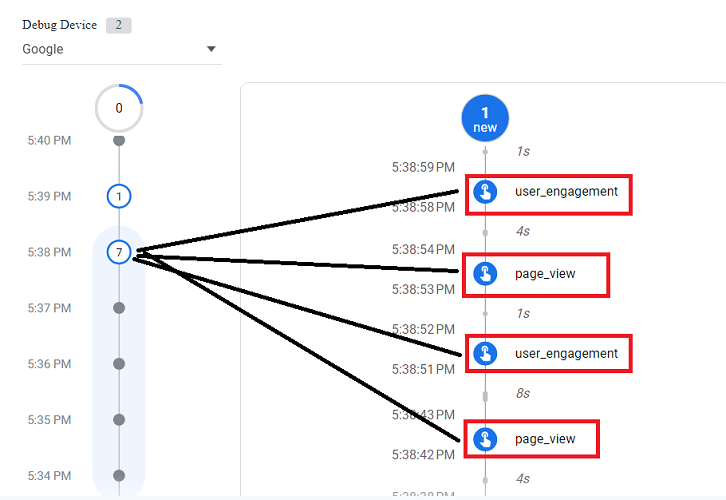
For example, in the screenshot below, 7 debugging events were recorded at 5:38 pm:
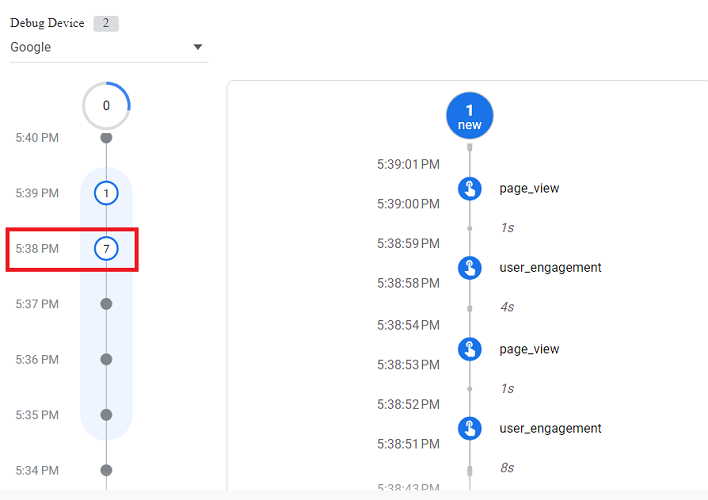
From the screenshot above, we can conclude that no event was fired until 5:38 PM. Then, at 5:38 PM, 7 events were fired. After that, at 5:39 PM, one event was fired. After 5:39 PM, no other event was fired.
Note: If you click a circle (with a number) in the Minutes stream, the Seconds stream will scroll up or down to the particular events logged during that minute.
#3 Seconds Stream – This stream shows a list of debugging events logged in the last 60 seconds. For example, you can see all the events logged at 5:38 PM in the seconds stream:
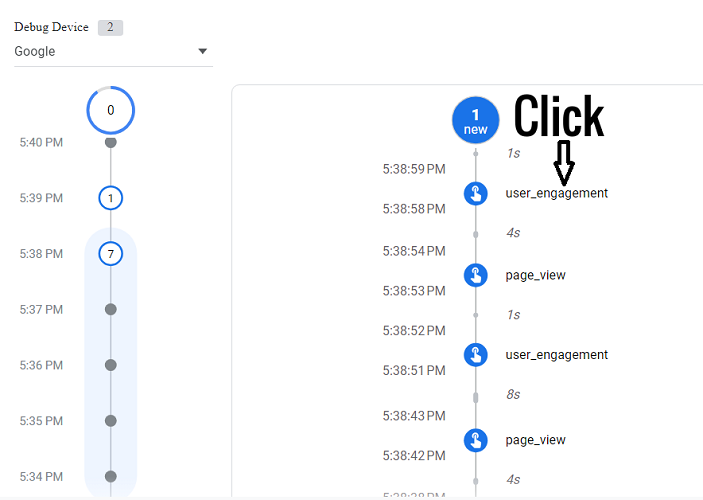
You can click on an event in the Seconds Stream to see a list of associated parameters and user properties.
For example, let’s click on ‘user_engagement’ event:
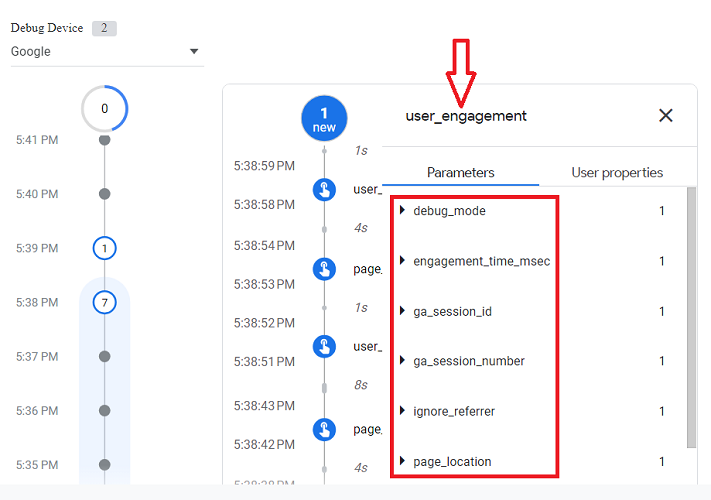
You should now see a list of parameters associated with the ‘user_engagement’ event:
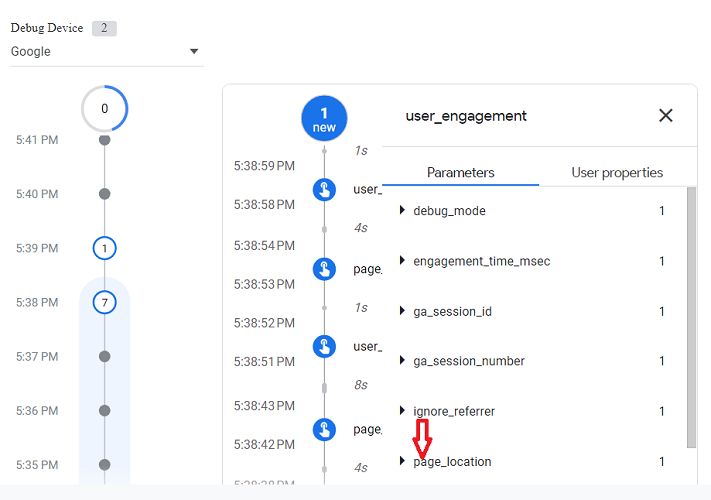
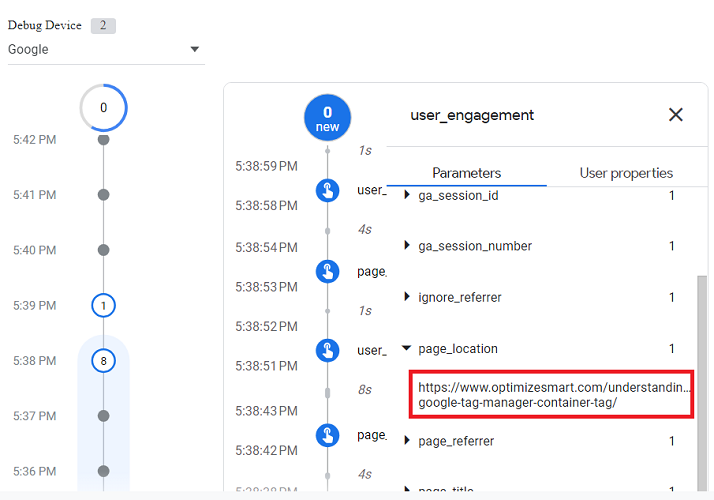
You can click on a specific parameter (say ‘page_location’) to see more details about the parameter:
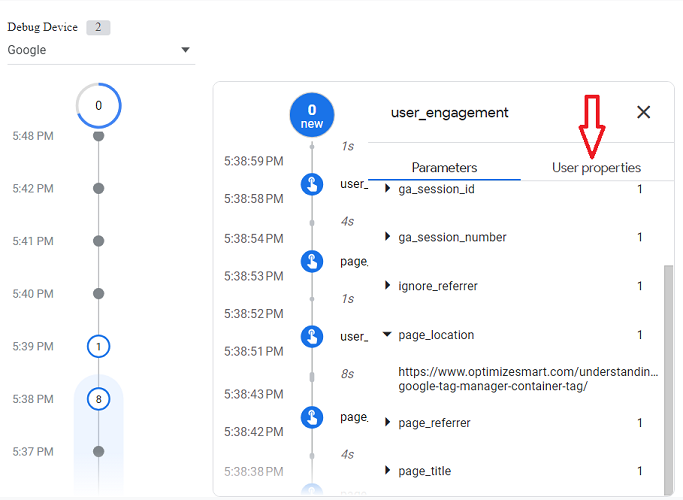
You can click on the ‘User Properties tab to see the list of user properties associated with the ‘user_engagement’ event:
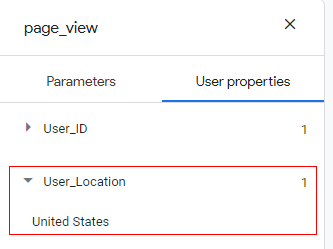
Let’s check the user properties set on the ‘page_view’ event:
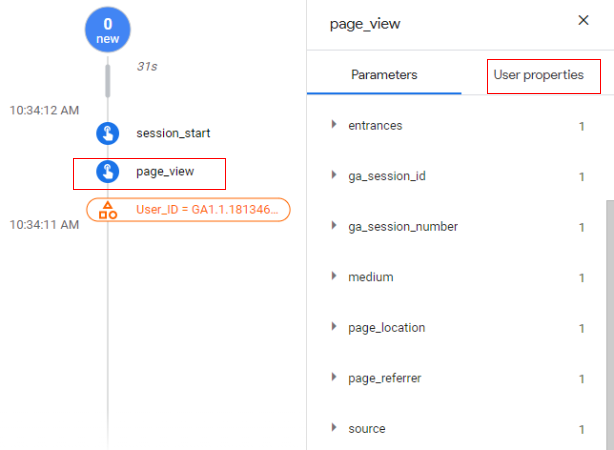
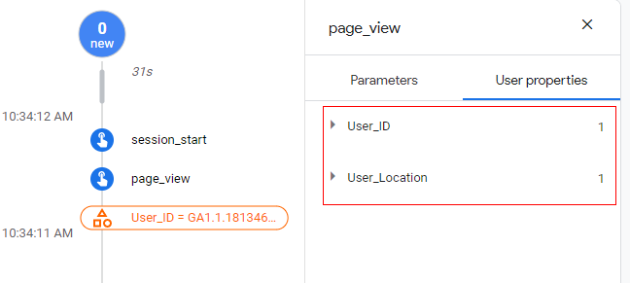
From the screenshot above, we can conclude that the following user properties are set on the ‘page_view’ event: ‘User_ID’ and ‘User_Location’.
You can click on a user property (say ‘User_Location’) to see what value is set for the user property:
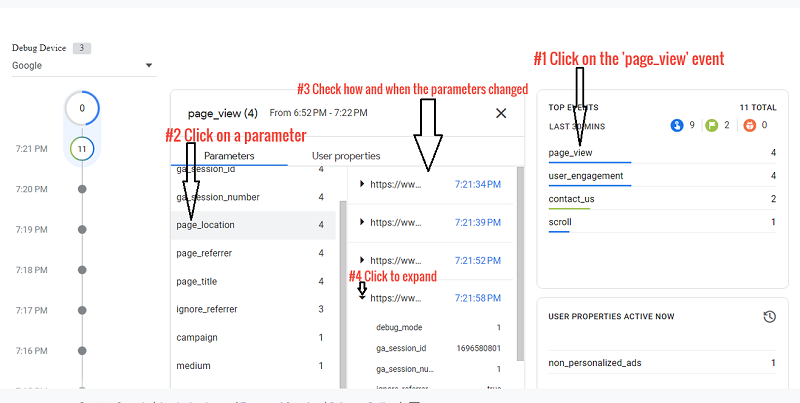
#4 Top Events – This section shows the top events (and their count) that were logged in the last 30 minutes. You can click on one of the events to determine how and when the associated parameter changed:
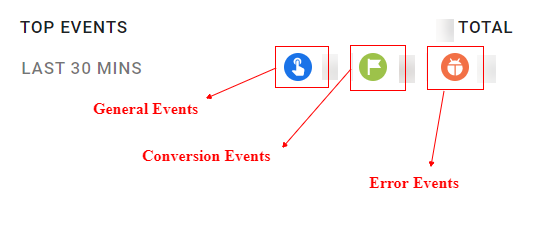
The top events are categorized as below
- General events: These are general events that you have configured for your GA4 property, like page_view, user_engagement, scroll, etc.
- Conversion events: If you have marked a particular event as a conversion event, it will be reflected here.
- Error Events: If there are any errors while debugging, they will be reflected in error events.
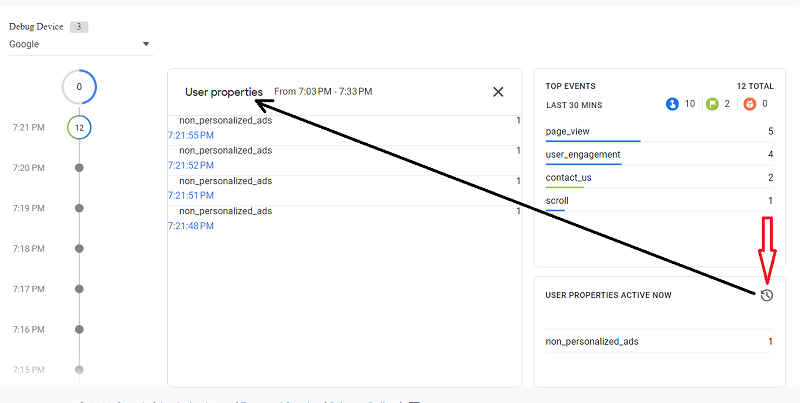
#5 User Properties – This section shows the latest state of the set of User Properties for the currently selected debugging device.
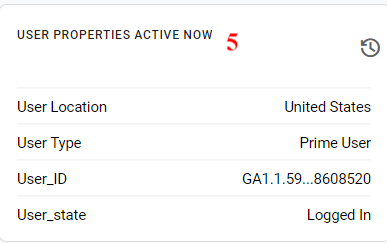
Click on the clock icon to see how the values changed for a particular user property in the last 30 minutes:
That is how you can use DebugView report in Google Analytics 4.

GA4 Debug View report not showing the data?
You only see events in GA4 DebugView when all of the following conditions are met. A failure in any one of them can make the report look empty.
- Debug mode is not enabled.
- You are looking at the wrong property or data stream.
- Events are blocked before they reach GA4.
- GA4 data filters and internal traffic rules.
- Server-side tagging specifics.
- Processing delays.
#1 Debug mode is not enabled.
DebugView only shows events that carry a debug signal.
Confirm at least one of these is true on the device you are testing:
- You are in GTM Preview mode for the container that fires GA4 tags (this automatically adds the debug parameter).
- You are using the GA Debugger Chrome extension, and GA hits go directly to GA4 (not via a server container).
- Your events include debug_mode (or _dbg) set to true. For example, via a GTM event parameter or by appending ?debug_mode=true to the test page URL.
- If GA requests do not contain a debug parameter, they will never appear in DebugView.
#2 You are looking at the wrong property or data stream.
DebugView is property- and stream-specific.
Confirm:
- The Measurement ID in your GA4 tag matches the GA4 data stream you opened DebugView in (Admin > Data streams).
- There are no duplicate GA4 tags firing with different IDs (e.g., a hardcoded gtag.js instance and a GTM tag).
A quick check: open DevTools > Network, look at collect / g/collect hits, and verify the tid / measurement_id matches the stream you are viewing.
#3 Events are blocked before they reach GA4.
Events can leave the browser but still be blocked or dropped:
- Consent or cookie banners are not set to deny analytics (especially with Consent Mode v2).
- No browser extensions or ad blockers are stripping GA4 requests (privacy-focused browsers such as Brave can do this silently).
- Content Security Policy or network firewalls are not blocking https://www.google-analytics.com or your tagging server endpoint.
Use DevTools > Network to confirm that GA4 requests are being sent and that they return 2xx responses.
#4 GA4 data filters and internal traffic rules.
Filters affect what appears in DebugView, not just standard reports.
- Check Data Filters (Admin > Data settings > Data filters). If an internal traffic filter is set to Active, hits from your office IPs may be excluded from DebugView.
- Temporarily switch such filters to Testing or Inactive while debugging.
- Confirm no other misconfigured filters are excluding your test device's traffic.
#5 Server-side tagging specifics.
If you use GTM Server-Side, browser-side debug tools do not always attach debug parameters correctly.
- The GA Debugger Chrome extension only decorates hits sent directly to GA4. It does not work for hits routed through a server container.
- In server-side setups, explicitly pass debug_mode from the client (for example, via an event parameter in your web GTM tag) so that it reaches the GA4 tag in the server container.
Without this, DebugView may show "No devices available" even though hits are reaching GA4.
#6 Processing delays.
Even in DebugView, expect some lag:
- A device requires at least one event with a debug flag to be processed before it appears. Give it a minute and refresh.
- Some debug events may appear with a delay of several minutes, or only a subset may show in near real time.
What is the difference between the GTM preview mode and the DebugView report?
GTM Preview Mode – The GTM preview mode lets you test your container tags, variables, and triggers before you publish them. It’s a sandbox environment for your GTM setup, allowing you to ensure that everything works as expected without affecting real users or live data.
GA4 Debug Report (DebugView) – This GA4 report lets you see events coming into your GA4 property in real time, but in a detailed debugging format. This is particularly useful for verifying whether certain events or parameters are being sent to GA4 correctly.
While both tools are geared towards debugging, their specific use cases differ slightly.
GTM Preview Mode is broader in scope, focusing on the entire GTM setup, whereas GA4 DebugView is specifically tailored for debugging events in a GA4 property.
Do not use/rely on the Realtime report for debugging GA4 implementations.
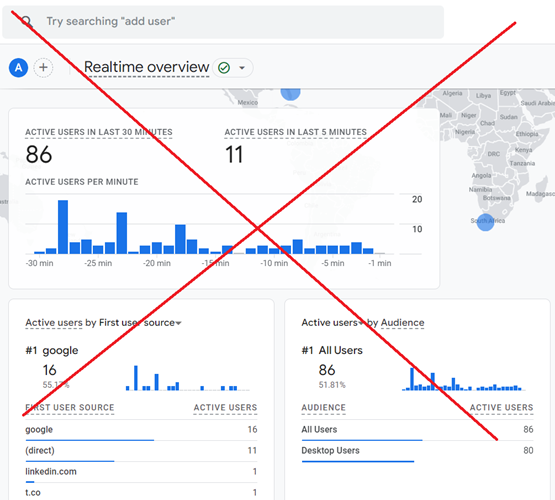
The GA4 realtime report displays aggregated data in near realtime.
However, this data has already been processed and may be subject to data filters orsampling.
You may not see all events and user properties.
Moreover, finding a specific debug event in realtime reports for high-traffic websites can be incredibly challenging.
With high traffic, thousands of events can be recorded every minute, making it a needle-in-haystack scenario to find your specific debug event.
This makes realtime reports less reliable for debugging purposes.
The DebugView report shows data at the hit level before any filters, sampling or configurations are applied.
Thus, the displayed data is raw and unprocessed, providing a more accurate and granular view of the data sent to GA4 than the real-time report.
Moreover, the DebugView report provides a more granular level of event detail, including specific user properties and custom parameters, which are essential for thorough debugging.
The data shown in DebugView is kept separate from the general data received by GA4 because debug mode is enabled. This is the biggest advantage of using the DebugView.
To use the DebugView report, you need to first enable the debug mode.
When debug mode is enabled (via methods such as the GA Debugger Chrome extension, GTM Preview mode, or sending a debug event parameter with GTM), it tags incoming data so that GA4 recognises it as separate from the normal data flow.
This segregation is beneficial as it prevents your testing data from skewing the overall metrics of your website/app.
Long story short, always use and rely on the DebugView report instead of the realtime report for debugging GA4 implementations.
How to Fix GA4 DebugView with Server-Side Tagging?
Here is how Server side tagging can prevent the GA4 DebugView report from working correctly and how you can fix this issue.
In a server-side tagging setup, if the Client ID or User ID is not correctly captured from the client side, the DebugView report may not be able to correctly associate events with the correct session.
In DebugView, you might see events that are not linked to the correct user or session, or events might not appear at all if the IDs are missing.
If the debug mode parameter (‘_dbg’ parameter) is not correctly captured or transmitted from the client side to the server side, events will not be flagged as debug events, and the events not marked as debug events do not appear in the debugView report.
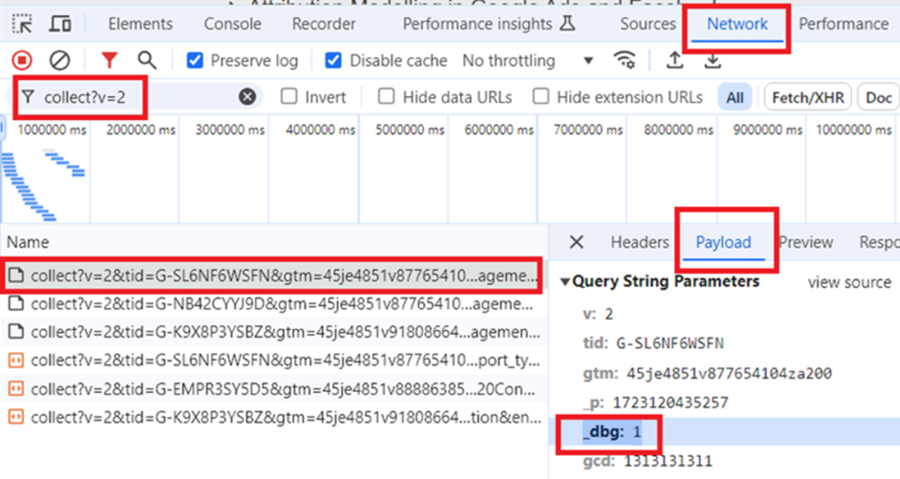
Enable debug mode for both client-side and server-side containers.
Both client-side and server-side containers must be in debug mode to track and view events correctly in the DebugView report.
If the debug mode is not enabled on either side, events may not appear in DebugView report.

Other Articles on GA4.
- Tracking New, Qualified and Converted Leads in GA4.
- Free GA4 training and tutorial with Certification.
- Understanding GA4 Ecommerce Reports (Monetization Reports).
- GA4 Ecommerce Tracking via GTM: Step-by-Step Setup Guide.
- How to see UTM parameters in GA4 (Google Analytics 4).
- GA4 UTM parameters not working? Here is how to fix it.
- How To Use UTM parameters in GA4 (Campaign Tracking).
- How to track AI traffic in GA4.
- Understanding Google Analytics 4 cookies – _ga cookie.
- GA4 (Google Analytics 4) Measurement Protocol Tutorial.
- GA4 Unassigned Traffic: Causes and How to Fix it Fast.
- GA4 Regex (Regular Expressions) Tutorial.
- GA4 Direct Traffic Spike: Common Causes and How to Fix Them.
- gtag.js – Google Tag in Google Analytics 4 and beyond.
- GA4 Scopes – User, Session, Event & Item scopes.
- GA4 Conversion Tracking (Key Events) Tutorial.
- GA4 (not set) - Guide to fixing (not set) issue.
- GA4 Certification Exam: Questions, Answers for Skillshop (GAIQ).
- GA4 User Properties (User Scoped Custom Dimensions) – Tutorial.
- Tracking Organic Traffic in GA4 - Complete Guide.
- Tracking Events in GA4 (Google Analytics 4).
- GTM Server Side Tagging - Setup Guide.
- Using Subfolder for GTM Server Side Tagging (Same Origin Tracking).
- Understanding Event Parameters in Google Analytics 4 (GA4).
- How to Uninstall GTM Server Side Tagging.
- How to remove (other) in GA4 reports and avoid Cardinality.
- Creating GA4 Assistant via Claude for your customers.
- How To Set Up User ID in GA4 - Cross Device Tracking.
- GA4 Mobile App Tracking - Firebase Integration.
- How to use DebugView report in Google Analytics 4 (GA4).
- How to Track Phone Calls in Google Analytics 4.
- How to detect GTM Server Side Tagging.

