

Once you understand how the GA4 data is stored in BigQuery data tables, it will become easier for you to query it.
What is the GA4 BigQuery Export Schema?
The GA4 BigQuery export schema refers to the structure of GA4 and Firebase data that is exported to a Google BigQuery project.
This schema defines how the data is organized within datasets and data tables.
To understand the GA4 BigQuery export schema, you will first need to understand the basic structure of how data is stored in a BigQuery project.
- Google Cloud Platform (GCP) can consist of one or more organizations.
- Each organization can consist of one or more projects.
- One such project can be a BigQuery project. It’s the environment within which all BigQuery datasets and operations reside.
- Each project has a name, project number, and project ID.
- Each project can consist of one or more datasets.
- Each dataset can consist of one or more data tables.

Project ID and Data Sets.
When you click on a project ID, you can see the datasets:
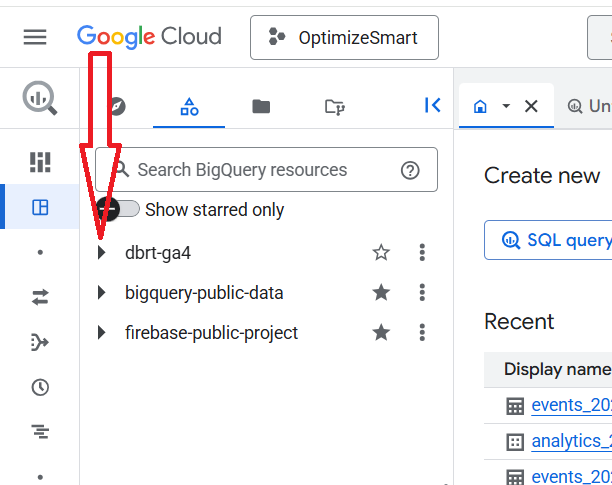
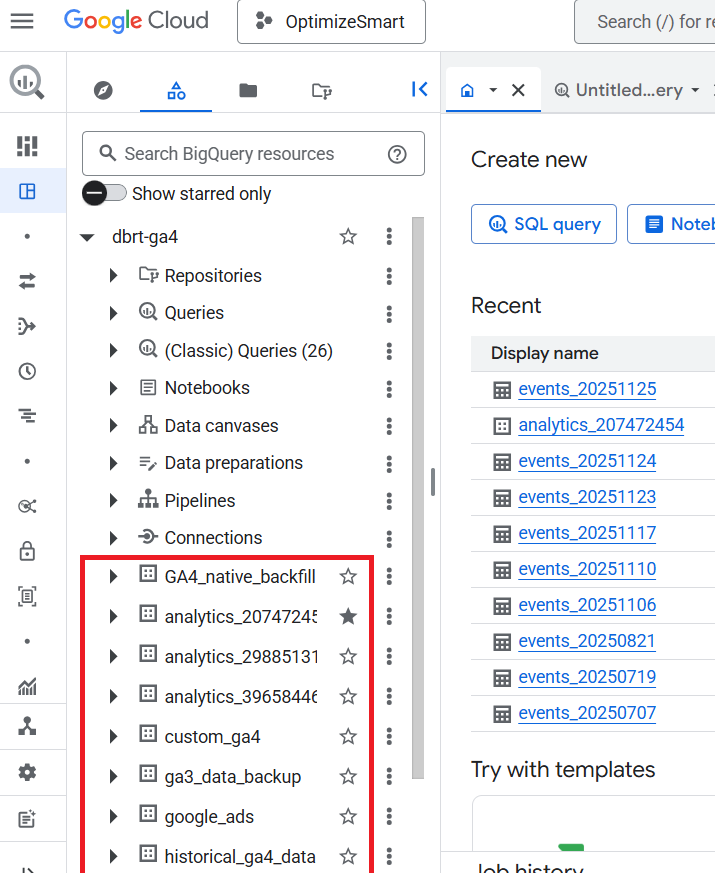
Here, the project id ‘dbrt-ga4’ contains the following data sets:
- GA4_native_backfill.
- analytics_207472454
- analytics_29885131
- analytics_39658446
- custom_ga4
- ga3_data_backup
- google_ads
- historical_ga4_data etc
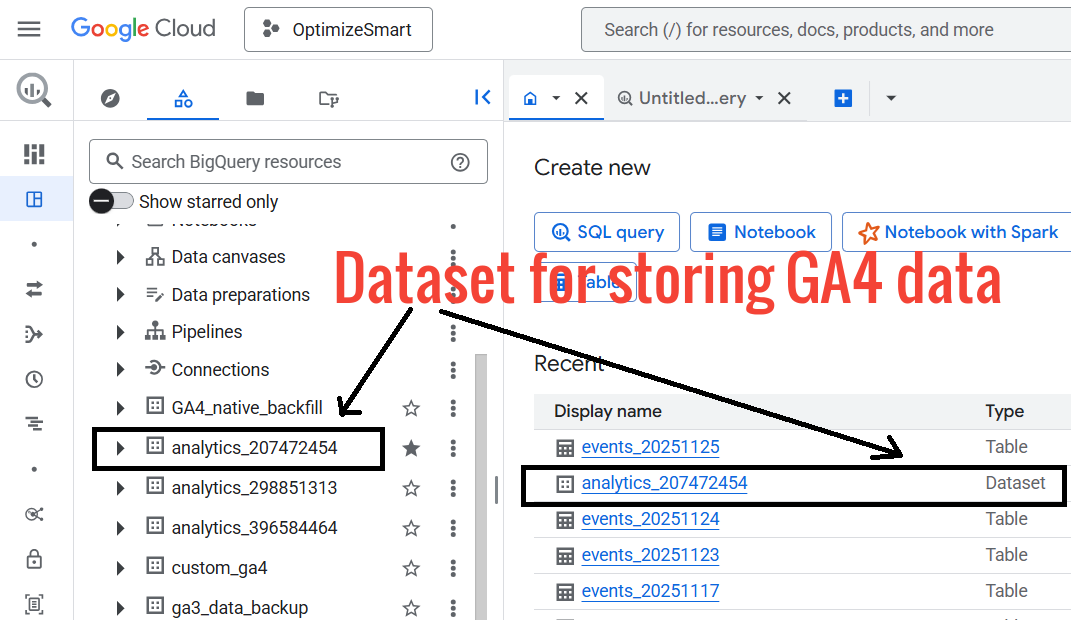
For every GA4 property and each Firebase project connected to your BigQuery project, a unique dataset called “analytics_<property_id>” is created in your BigQuery project.
The “property_id” is your GA4 Property ID.
The dataset named in the following format: “analytics_<property_id>” is the dataset meant for GA4:
Click on the dataset named in the following format: “analytics_<property_id>” .
Click on the 'Details' tab:
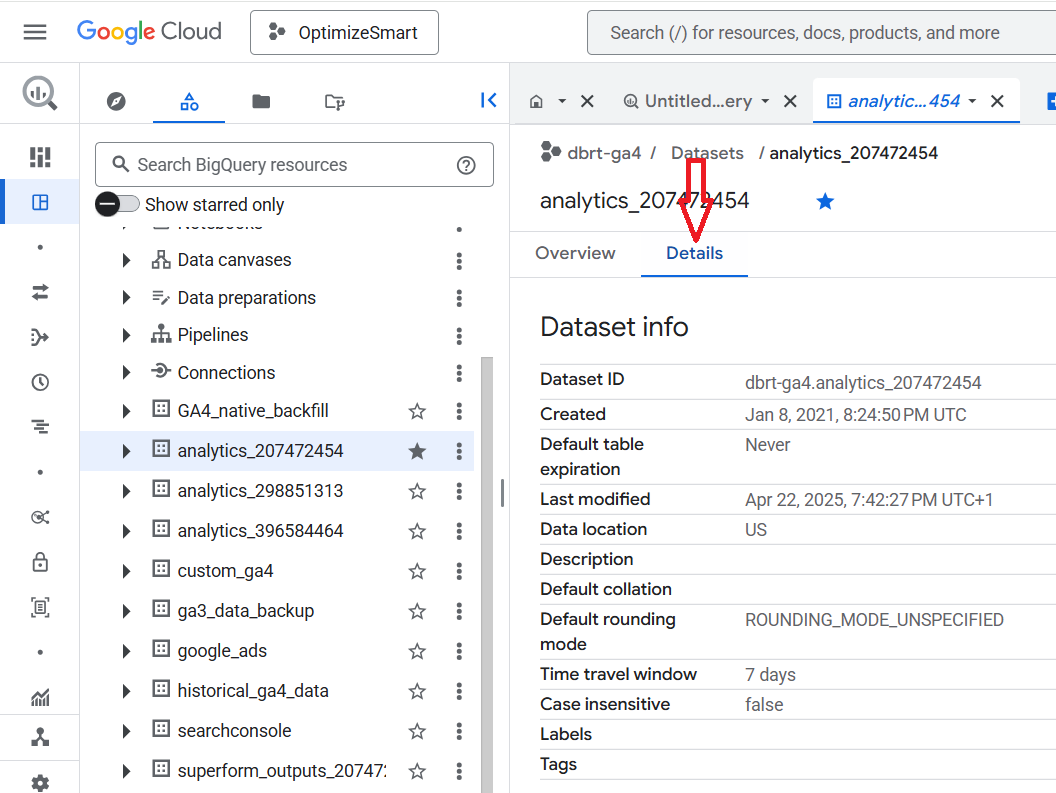
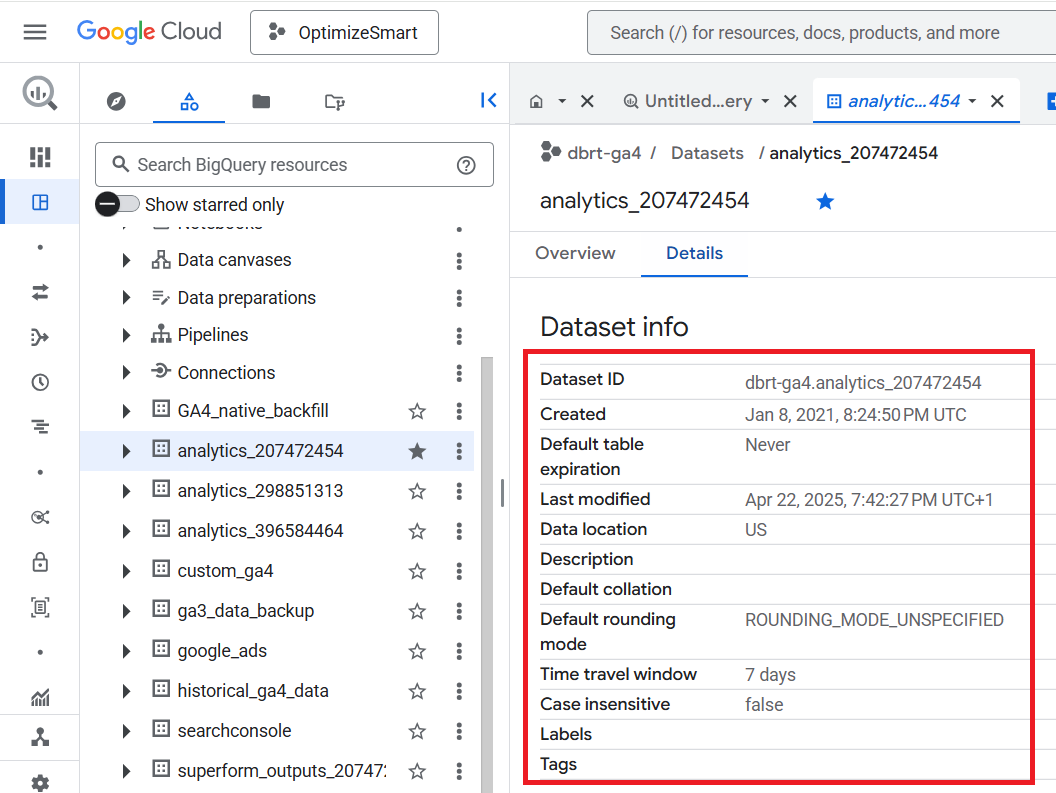
You should now be able to see the data set information like ‘Dataset ID’, Dataset creation date, Last modification date, Data location etc:
Note down the Dataset ID by copying it to the clipboard:
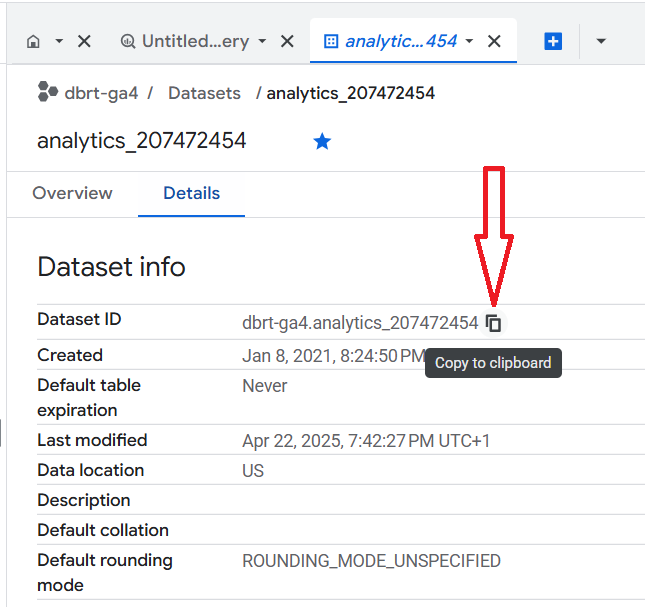
We will reference this dataset ID later when querying the data.
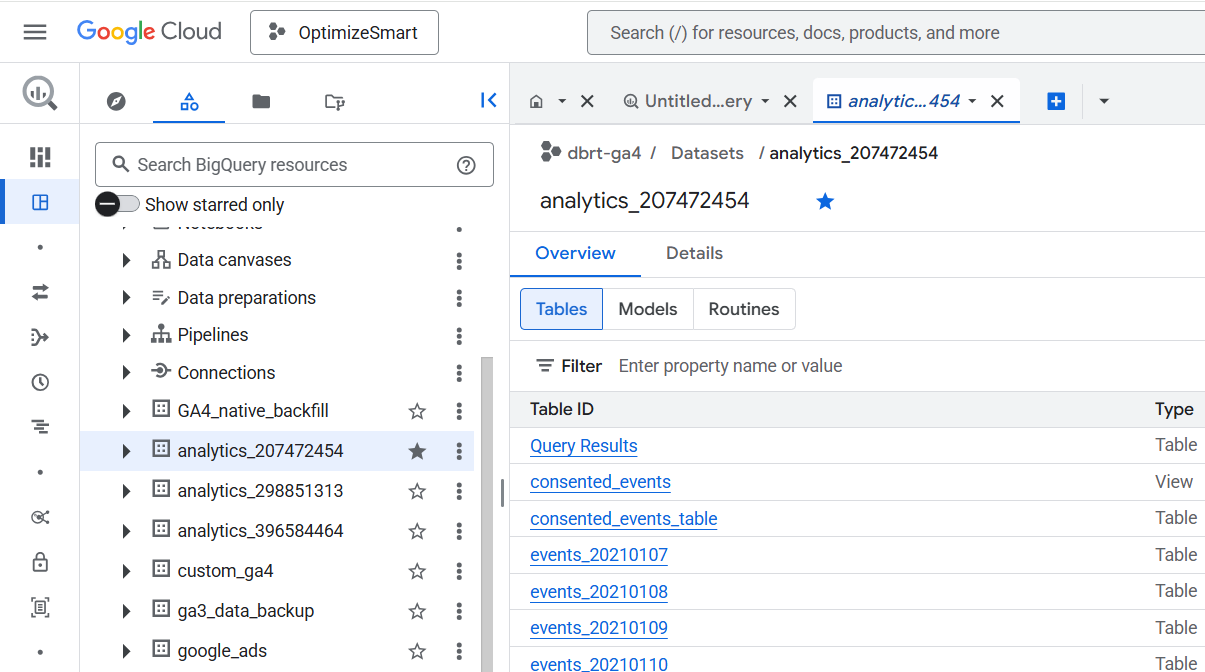
Click on the ‘analytics_’ dataset again.
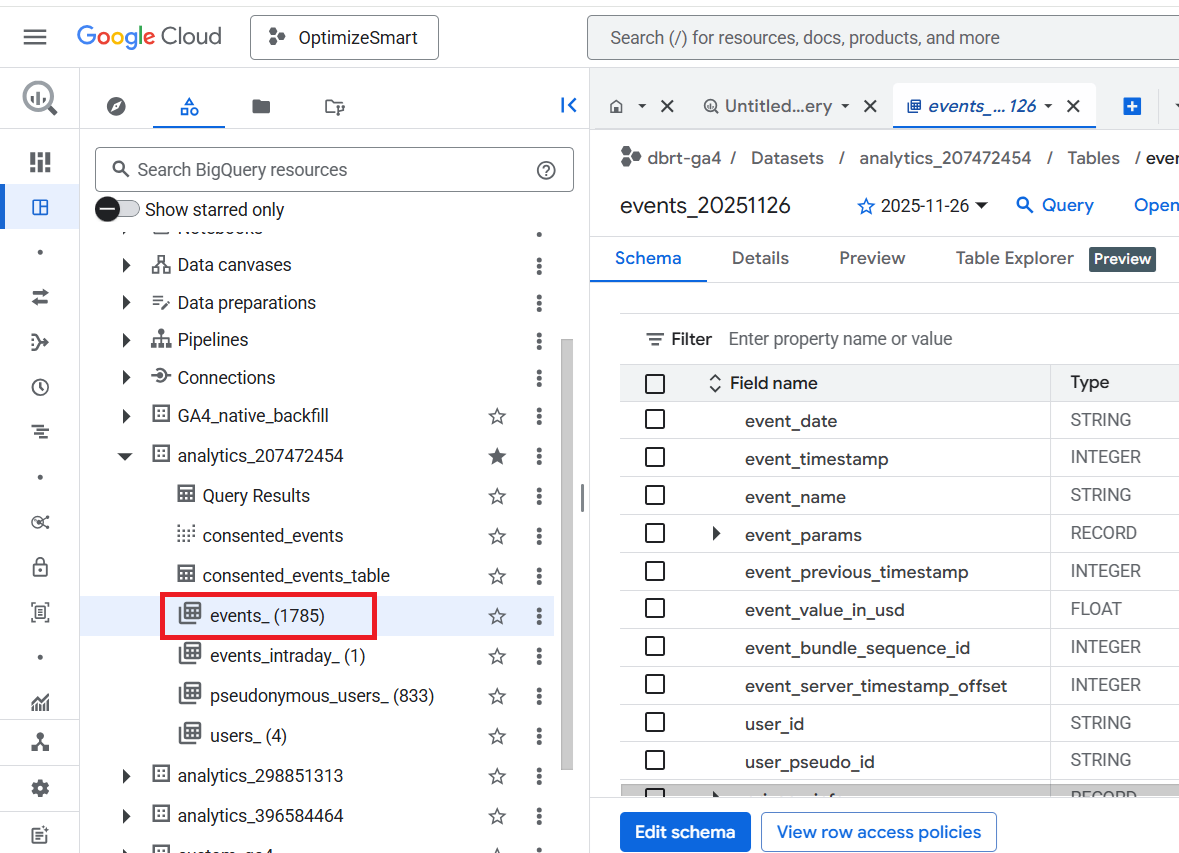
You should now see the following data tables:
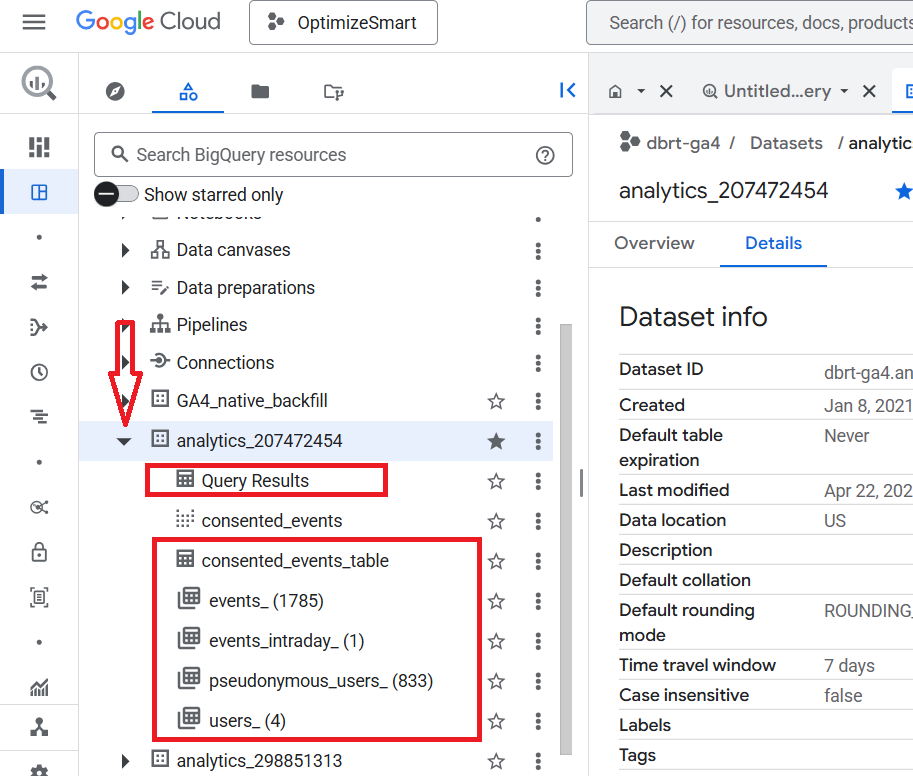
Each dataset consists of one or more data tables.
The ‘analytics_207472454’ dataset contains the following six data tables:
- Query Results.
- consented_events_table.
- events_(<number of days>)
- events_intraday_<number of days>
- pseudonymous_users_<number of days>
- users_<number of days>
‘events_’ and ‘events_intraday_’ Data Tables.
The ‘events_’ and ‘events_intraday_’ data tables contain event-based and user-based GA4 export data in BigQuery.
All the GA4 event data from the previous day(s) is available in the ‘events_’ data table.
This table is automatically imported for each day of export.
events_(1) means all of the GA4 event data from the previous day are available in this data table.
events_(2) means all of the GA4 event data from the previous two days are available in this data table.
events_(3) means all of the GA4 event data from the previous three days are available in this data table.
Similarly,
events_(1785) means all of the GA4 event data from the previous 1785 days are available in this data table.
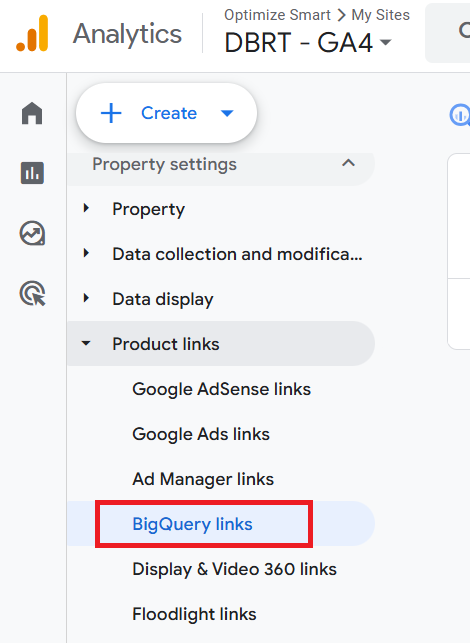
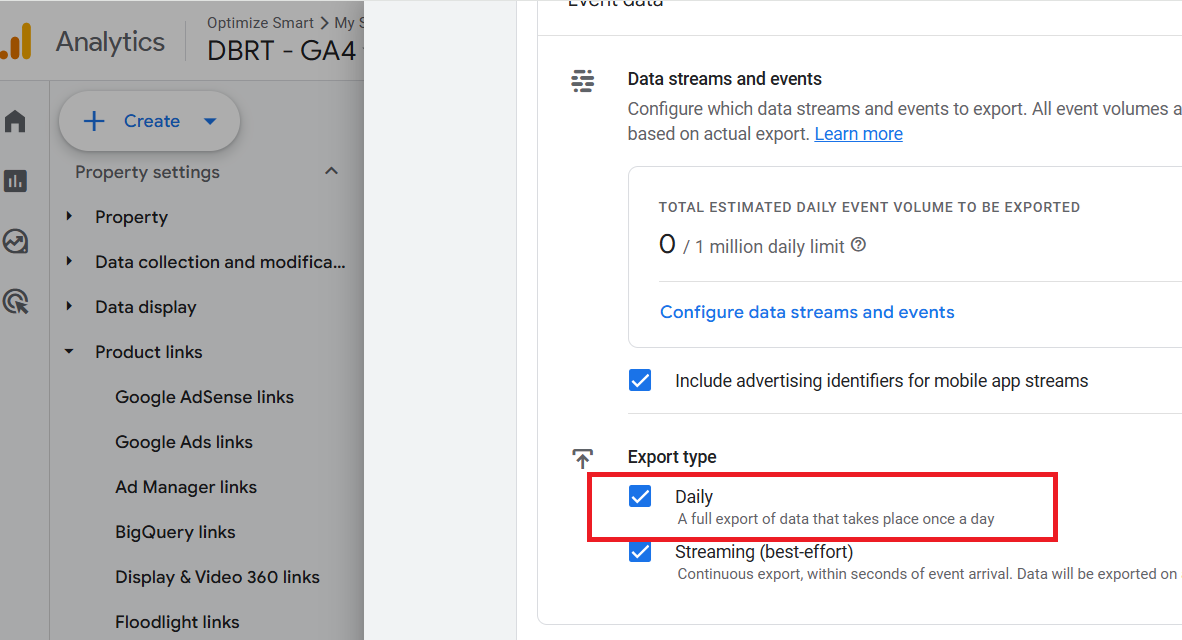
The ‘events_’ data table corresponds to the ‘Daily’ frequency setting of ‘BigQuery Links’ in your GA4 property:
All the GA4 event data from the current day is available in the ‘events_intraday_’ data table.
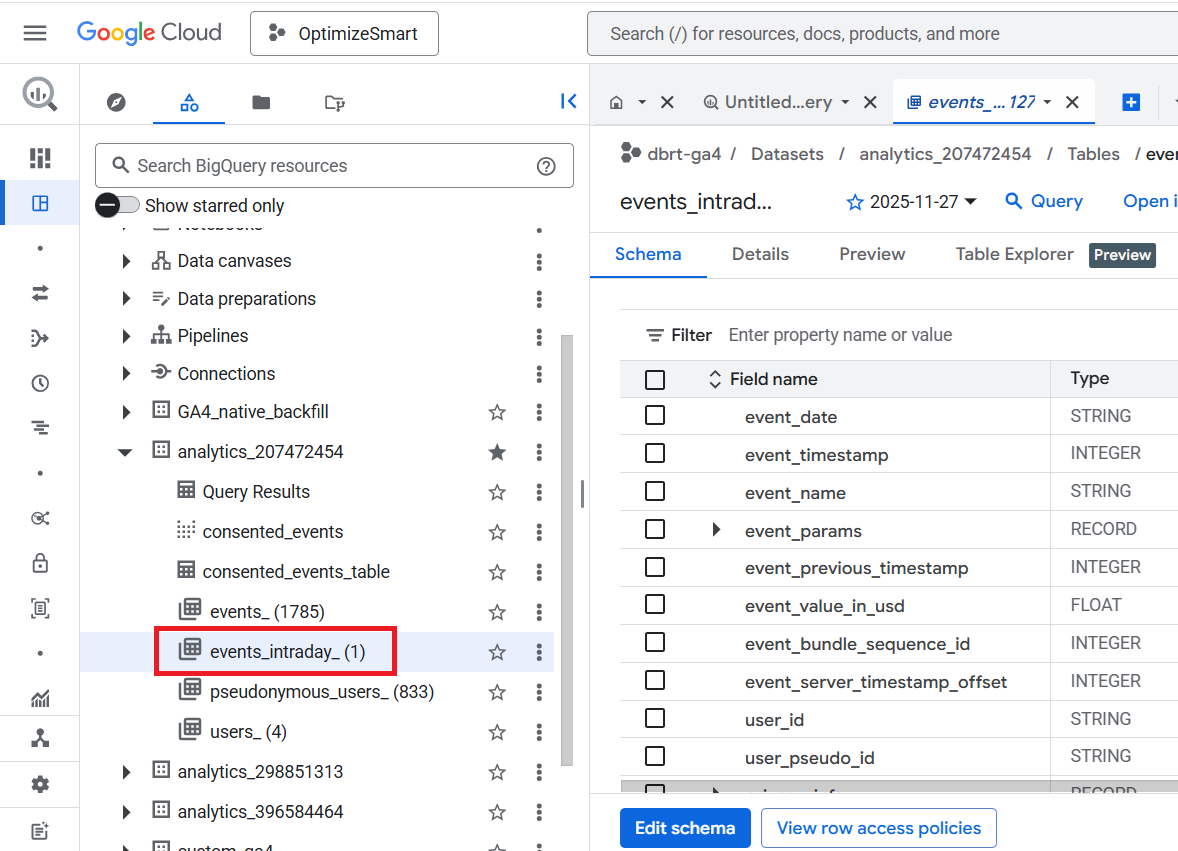
This table is automatically updated throughout the day. That’s why it is called the ‘events_intraday’ table.
Note: We usually do not query GA4 data from the ‘events_intraday_’ data table.
‘pseudonymous_users_’ and ‘users _’ Data Tables.
The ‘pseudonymous_users_’ and ‘users _’ data tables contain only user-based GA4 export data in BigQuery.
The advantage of using the ‘pseudonymous_users_’ and ‘users _’ data tables over the ‘events_’ and ‘events_intraday_’ data tables is that you get access to more user data.
The ‘pseudonymous_users_’ and ‘users _’ data tables contain audience and prediction data, which is not available in the ‘events_’ and ‘events_intraday_’ data tables.
There are three main ways to create a pseudonymous identifier in GA4:
#1 User ID – You can create your own unique identifier for each user and send it to Google Analytics. You can use the login id as the user id.
#2 Google Signals – Google Signals is a feature that allows you to track users across devices and platforms, provided they are signed in to their Google accounts across devices and have turned on ad personalization.
#3 Device ID – This is the default method GA4 uses to track users based on the device they’re using. If you aren’t using User ID or Google Signals, the device IDs are used.
The ‘pseudonymous_users_’ data table contains all the data for every pseudonymous identifier that is not a user ID.
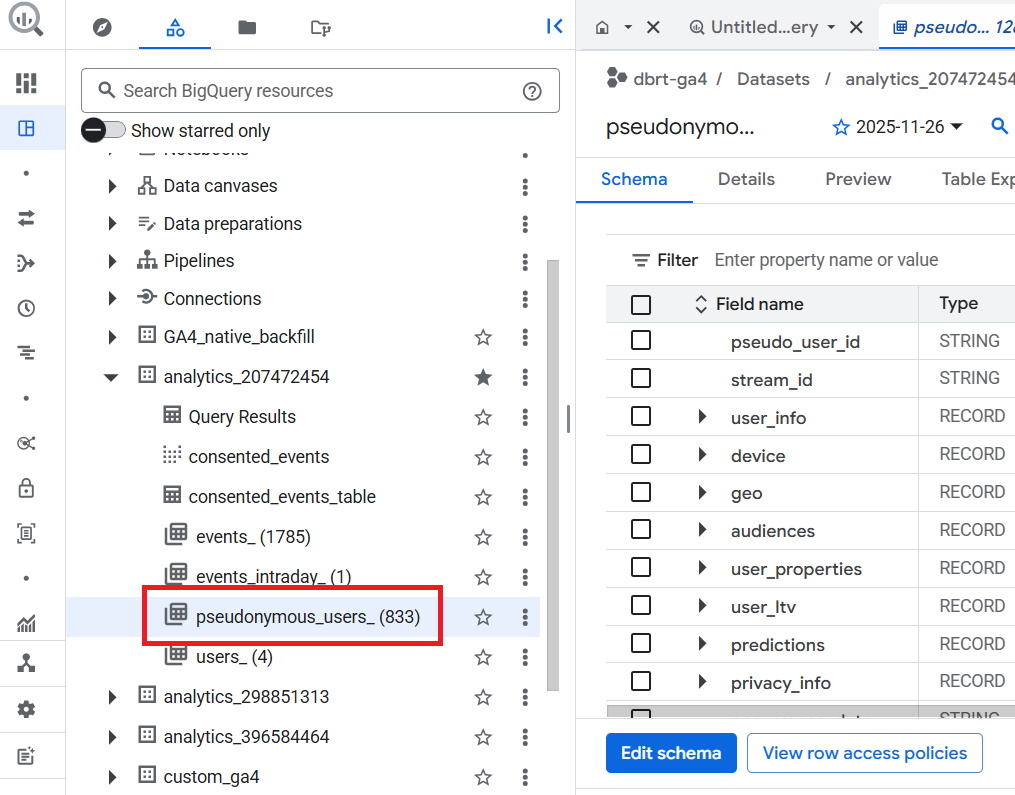
A pseudonymous identifier is a unique identifier (like ‘Google Signals’ or ‘Device ID’) created and assigned to each user by Google Analytics to track users across devices and sessions and to create a complete picture of their behaviour.
The ‘pseudonymous_users_’ data table is updated whenever data for a user is updated.
pseudonymous_users_(1) means all the data for every pseudonymous identifier that is not a user ID from the previous day is available in this data table.
pseudonymous_users_(2) means all the data for every pseudonymous identifier that is not a user ID from the previous two days is available in this data table.
Similarly,
pseudonymous_users_(833) means all the data for every pseudonymous identifier that is not a user ID from the previous 833 days is available in this data table.
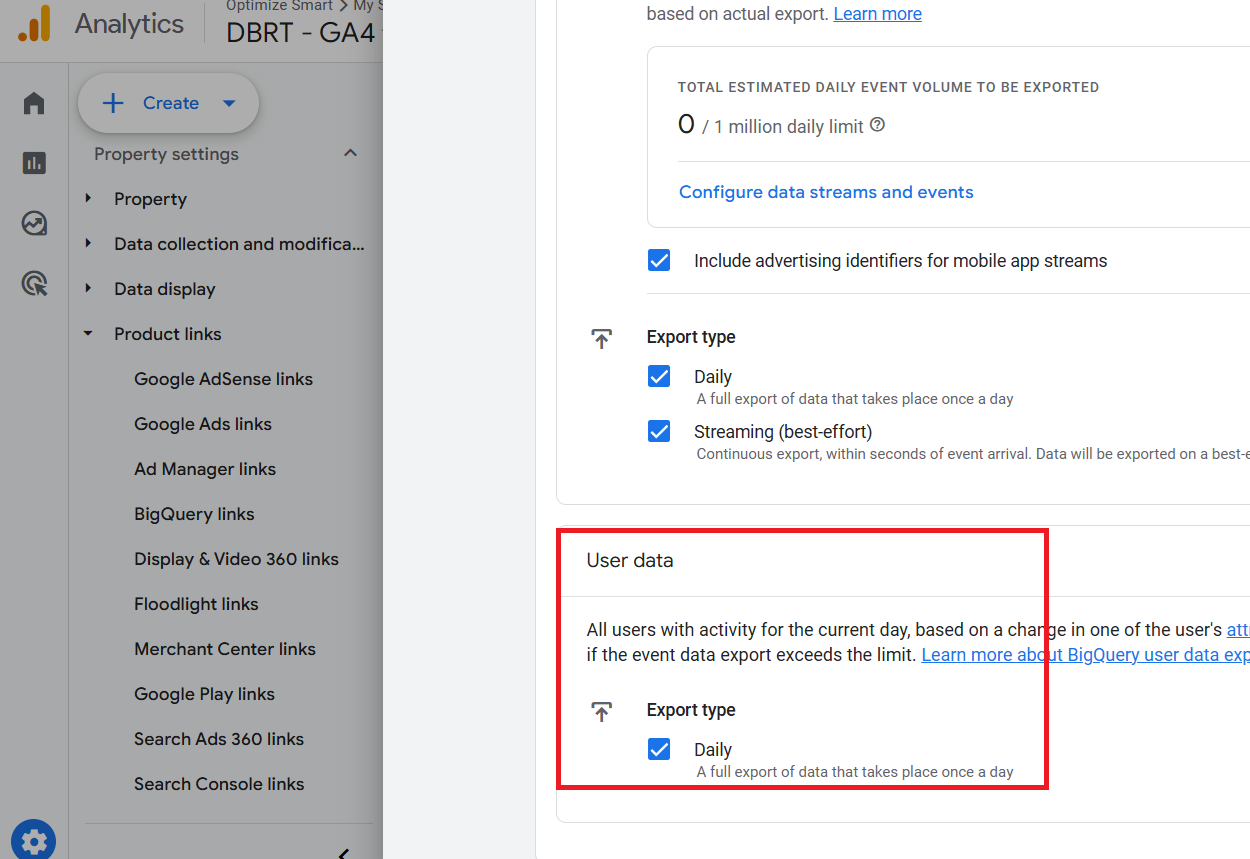
The ‘pseudonymous_users_’ data table corresponds to the ‘Daily’ frequency setting under ‘User data’ of ‘BigQuery Links’ in your GA4 property:
The ‘users_’ data table contains all the data for every pseudonymous identifier that is a user ID.
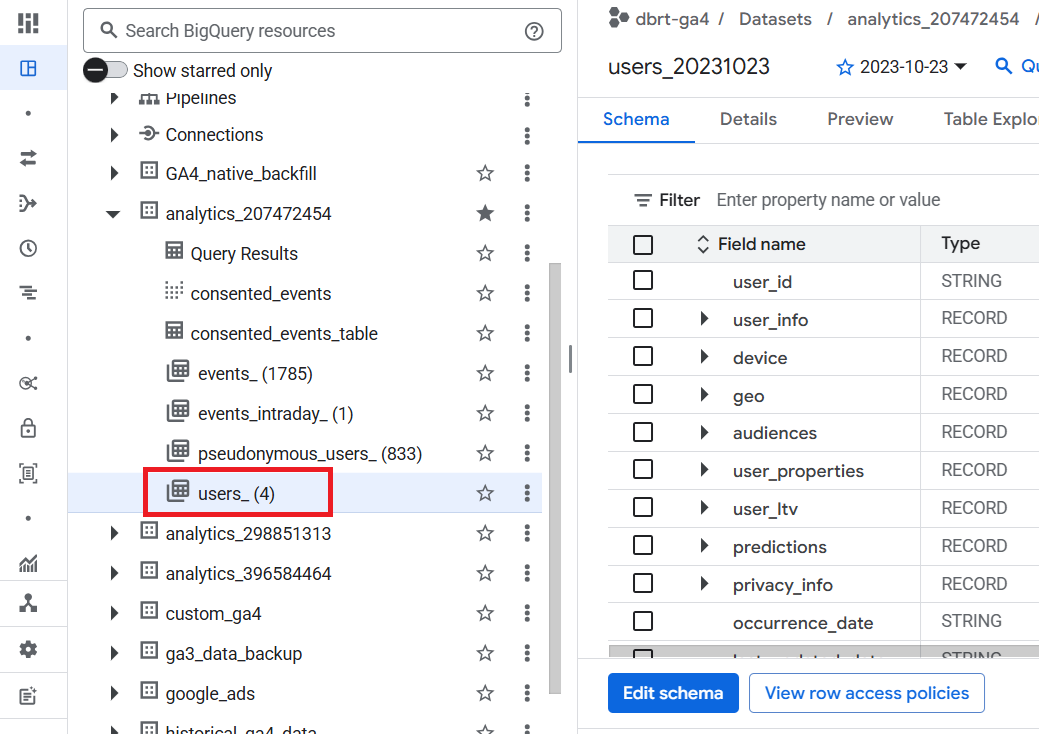
Data for a user is updated when there is a change to one of the fields.
Important points to remember about the ‘users_’ data table
#1 The ‘users_’ data table is not available to you in your BigQuery project if you are not using the user-id tracking in GA4.
#2 The ‘users_’ data table is not available to you in your BigQuery project if the ‘daily’ export type under ‘User data’ is not enabled when you link your GA4 property with your BigQuery project.
#3 Unlike in the ‘pseudonymous_users_’ data table, the data for unconsented users can be exported to the ‘users_’ table if it includes a user ID.
The SCHEMA tab of the data table.
Clicking on the ‘events_’ data table will show you the structure of that table (also known as ‘Schema’):
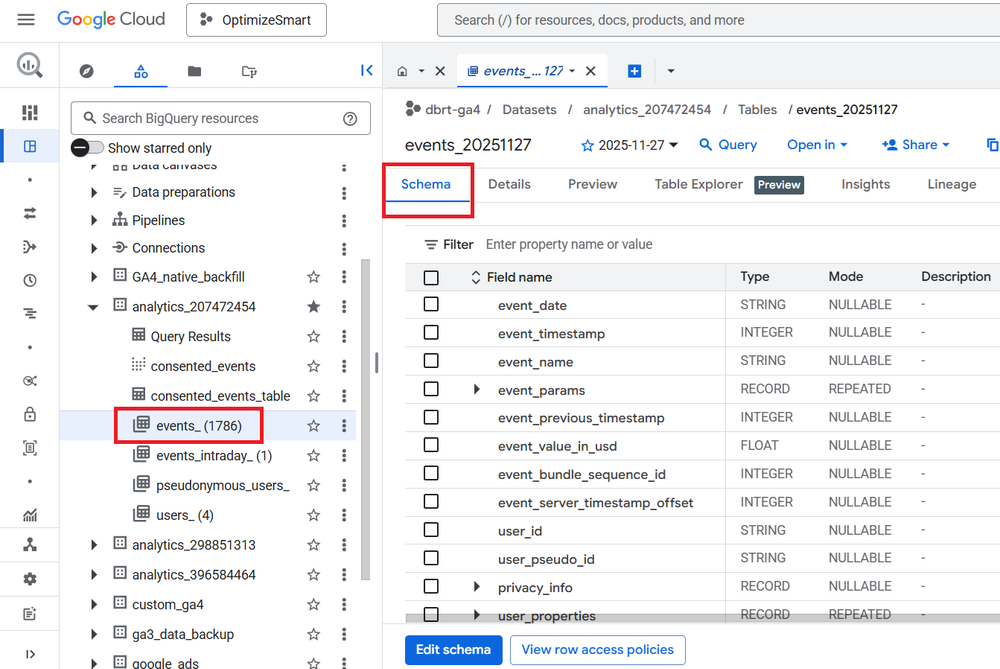
The schema shows how the data table is set up, what types of values it accepts, etc.
Take a close look at the various fields available under the ‘SCHEMA’ tab:
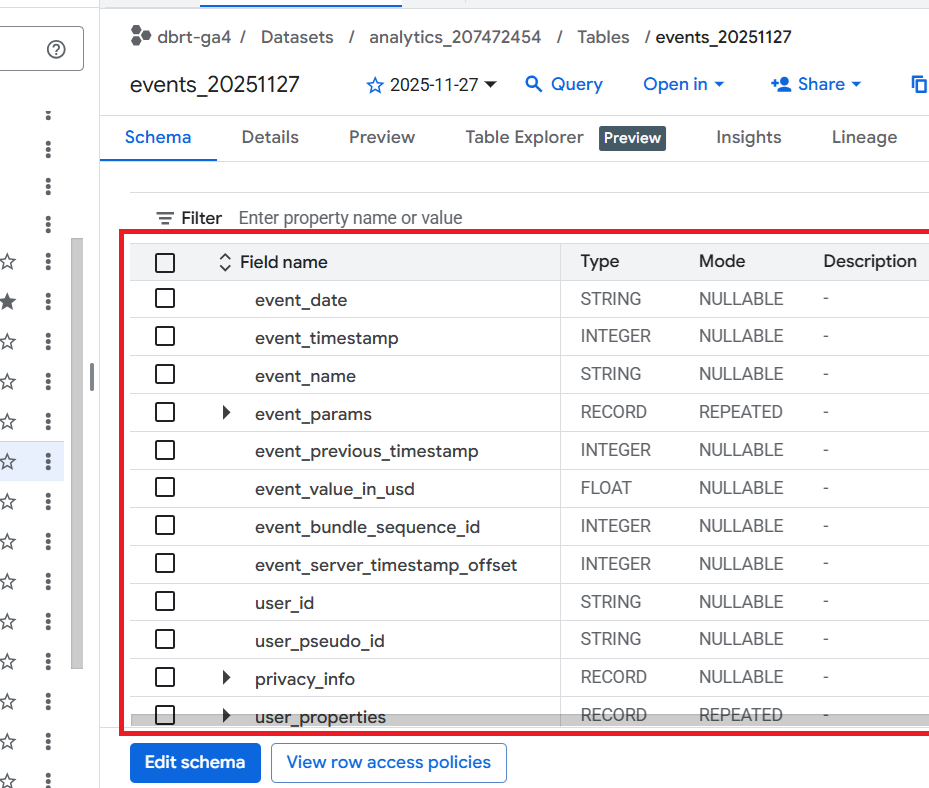
We will reference these fields when querying the GA4 data.
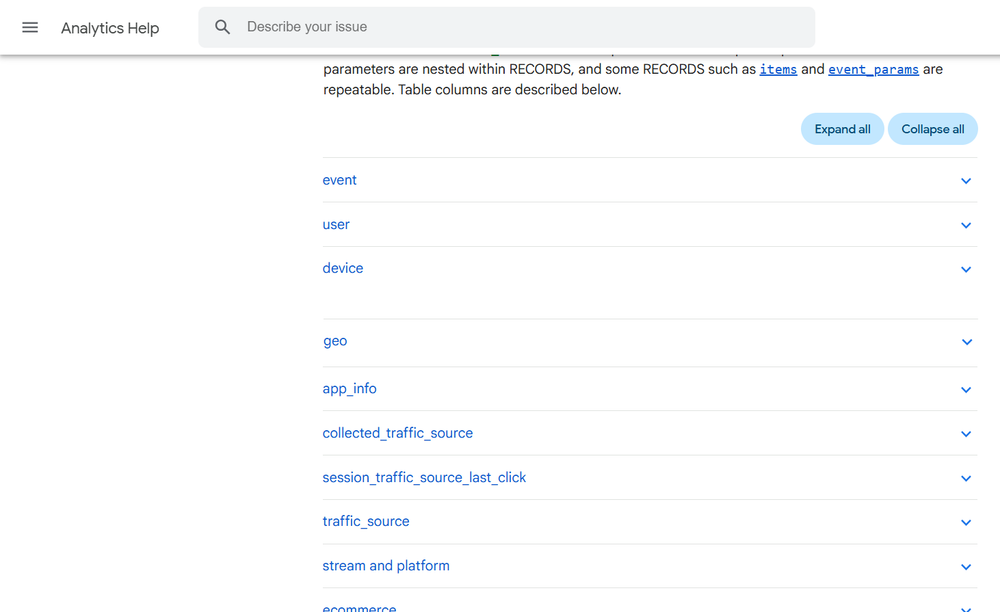
Bookmark the [GA4] BigQuery Export schema help documentation from Google to find more information about each field:
You can increase or decrease the size of the right-hand side panel by dragging with the mouse:

Selecting a Data Table based on Date.
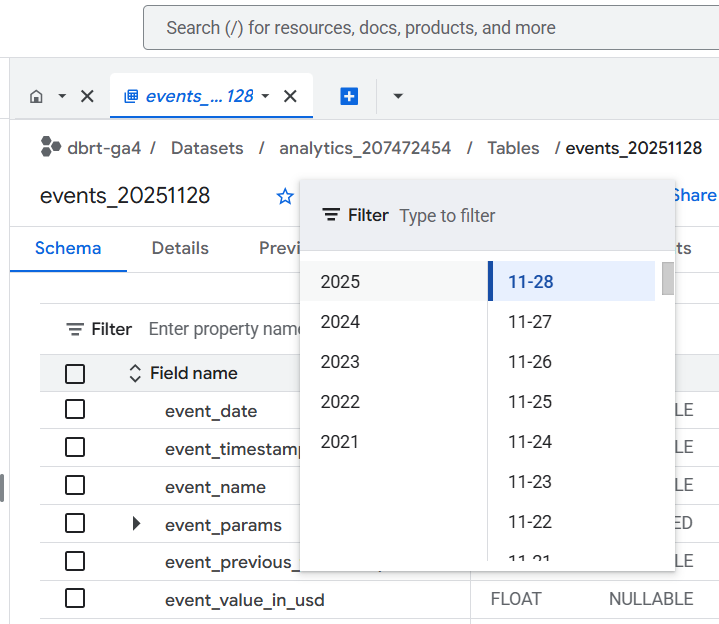
The ‘events_’ data tables are named “events_YYYYMMDD”, where “YYYYMMDD” refers to the date the table was imported into BigQuery.
YYYY denotes a year. For example, 2025
MM denotes a month. For example, 11 (i.e. November)
DD denotes a day. For example, 28
So the data table that was imported to BigQuery on Nov 28th, 2025 would be named as events_20251128
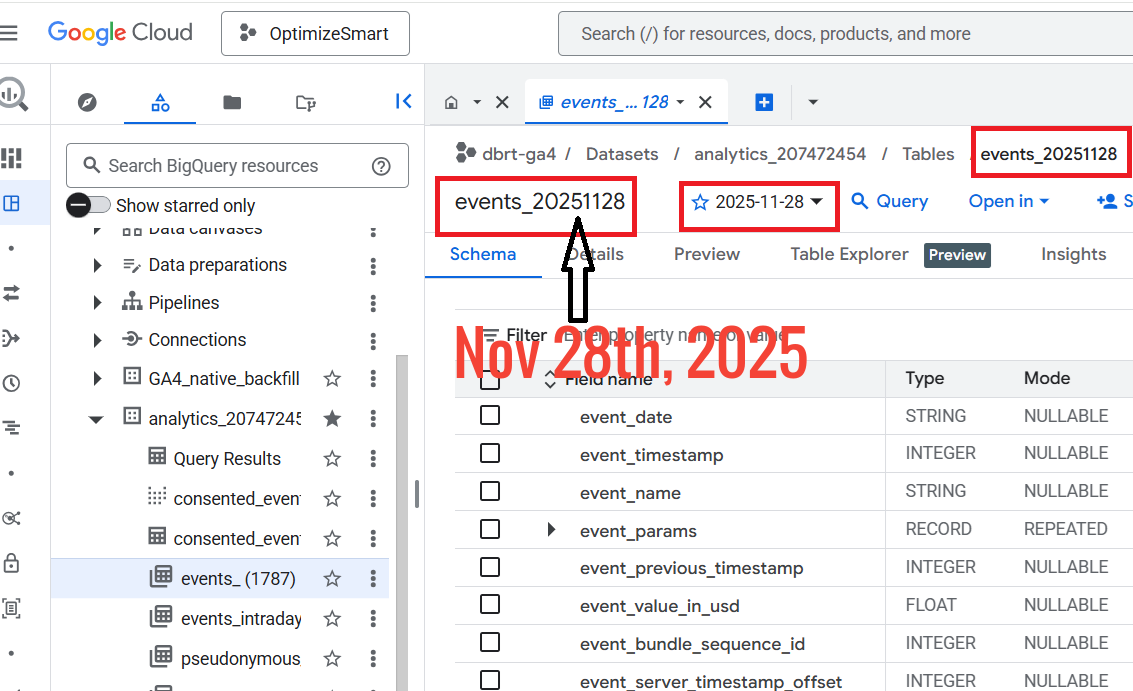
So you are looking at the data for Nov 28th, 2025.
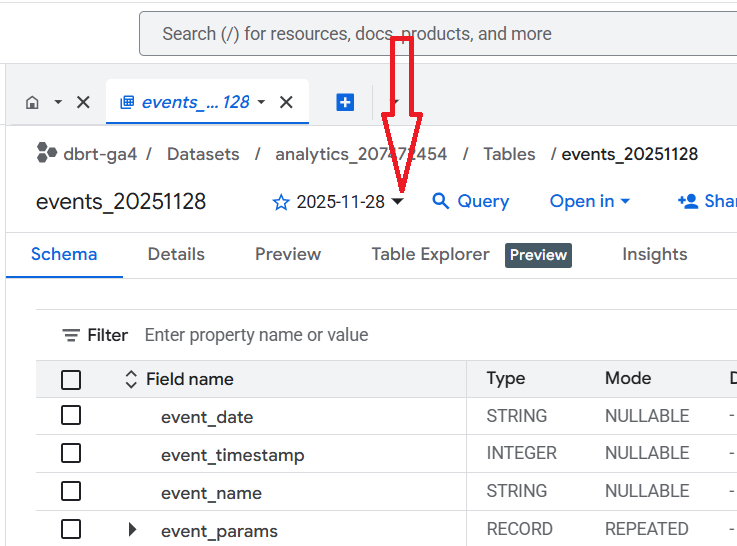
If you want to look at data for a different date, then click on the date drop-down menu and select a different date:
Note(1): I have been collecting GA4 data in BigQuery for years. So you will unlikely see the option to see data for several years.
Note(2): By default, the GA4 data is imported to BigQuery only from the date you first connected your GA4 property to your BigQuery project. If you want historical GA4 data in your BigQuery project, you'll need to backfill it using a paid connector.
The DETAILS and the PREVIEW tabs of the Data Table.
Click on the ‘DETAILS’ tab to get information about the data table:
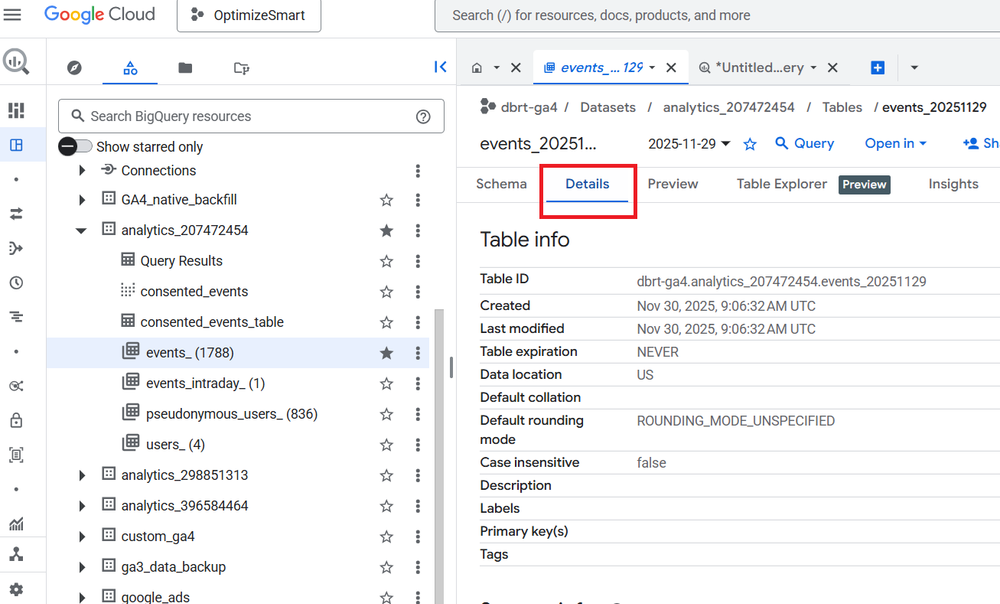
Take note of the table ID:
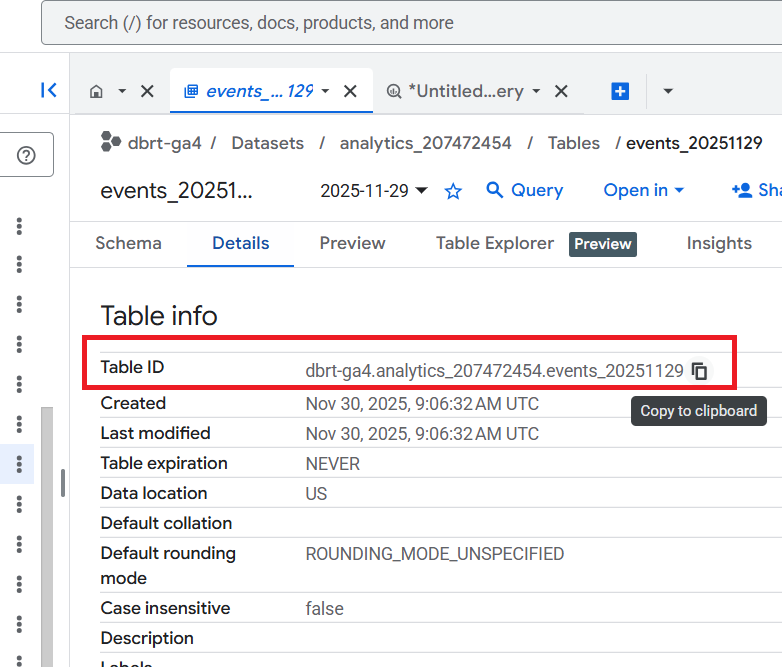
We will reference the table ID later when querying the GA4 data.
Look at the ‘Storage Info’ section to determine the size of your data table:
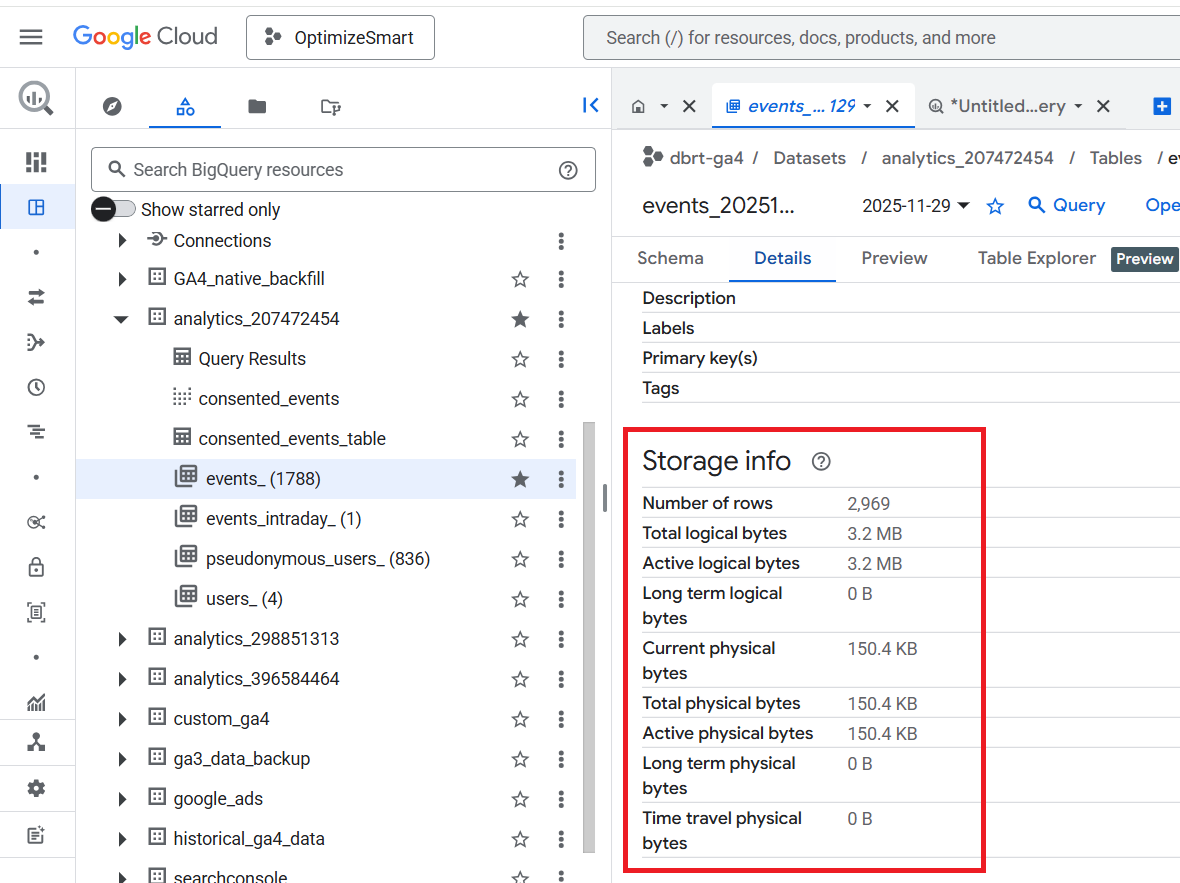
It is always best practice to check the size of a table before querying it.
If the size of the data table is just a few kilobytes (KB) or megabytes (MB), you don’t need to worry.
But if the table size is in gigabytes (GB), terabytes (TB) or petabytes (PB), you should be careful how you query your data.
Your monthly cost of using BigQuery depends upon the following factors:
#1 The amount of data you store in BigQuery (i.e. the storage cost)
#2 The amount of data you processed by each query you run (i.e. the query cost).
The first 10 GB of active storage is free each month. After that, you would be charged $0.020 per GB of active storage.
The first 1 terabyte of data processed is free each month. After that, you would be charged $5 per terabyte (TB) of data processed.
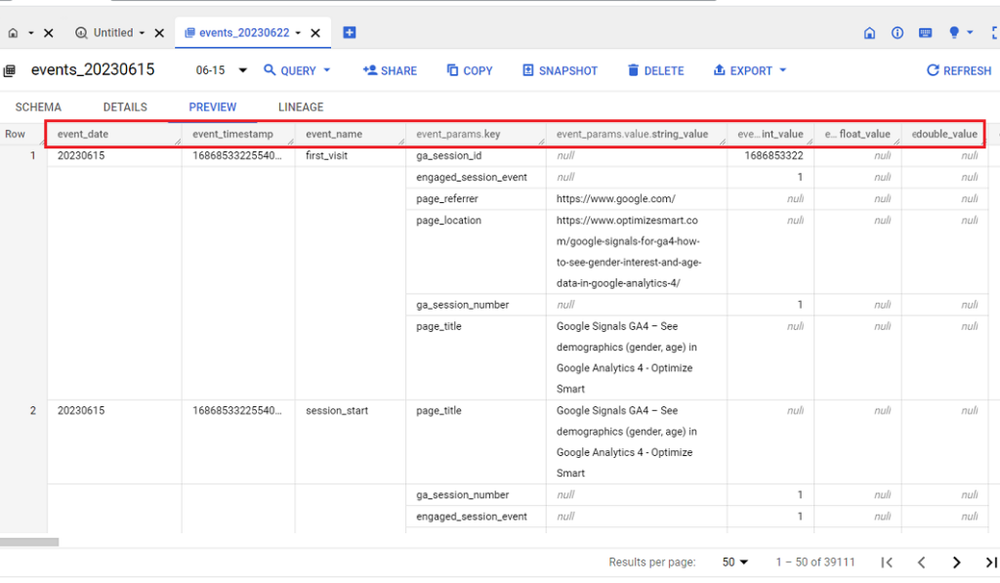
Click on the ‘Preview’ tab to view the data in the ‘events_’ data table:
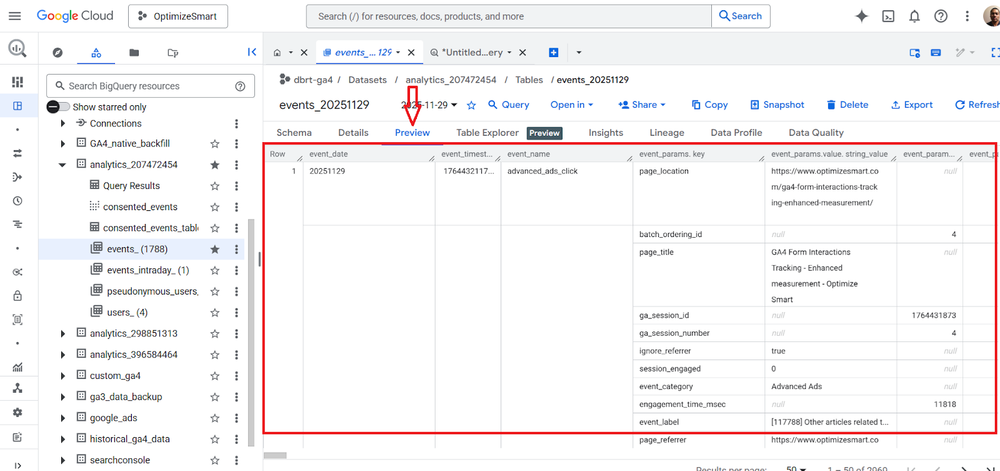
It is always best practice to preview a table before querying it.
Many people, especially new users, run queries just to preview the data in a data table. This could considerably cost you if you accidentally query gigabytes or terabytes of data.
Instead of running queries just to preview the data in a data table, click on the ‘Preview’ tab to preview the table.
There is no cost for previewing the data table.
The table preview gives you an idea of the data available in the table without querying it.
Rows and Columns of the Data Table.
From the table preview, you can see that the table is made up of rows and columns:
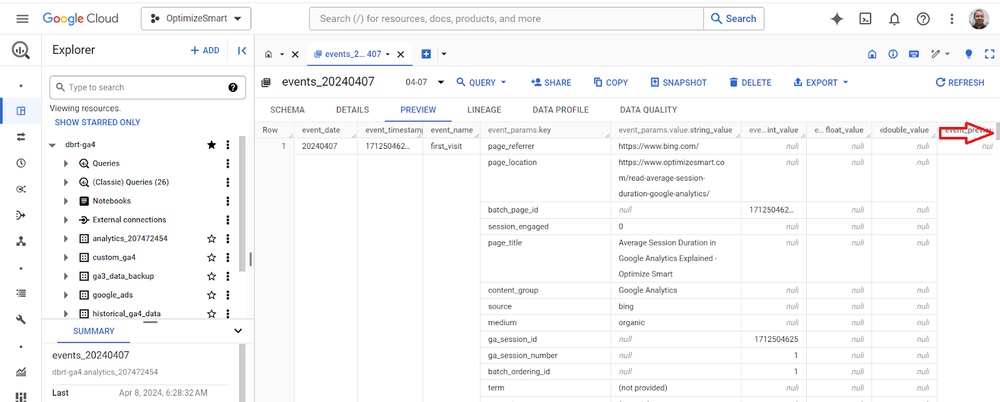
Use the horizontal slider to see more columns:
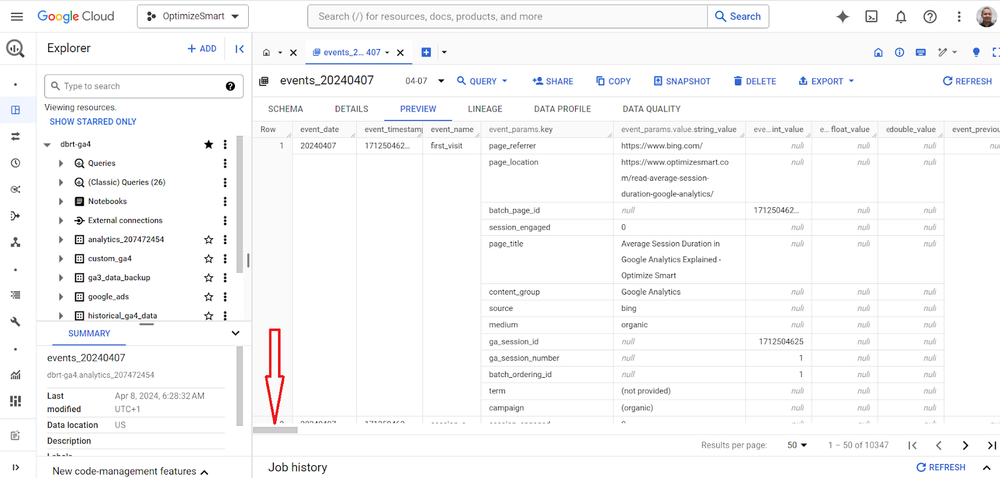
Use the vertical slider to see more rows:
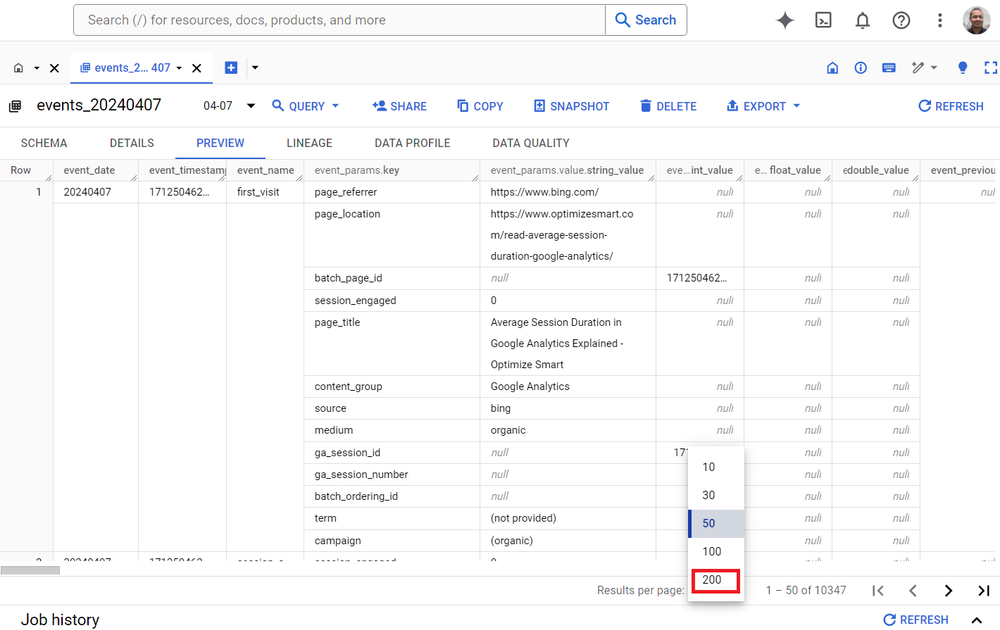
Use the ‘Results per page’ drop-down menu if you want to see more than 50 rows:
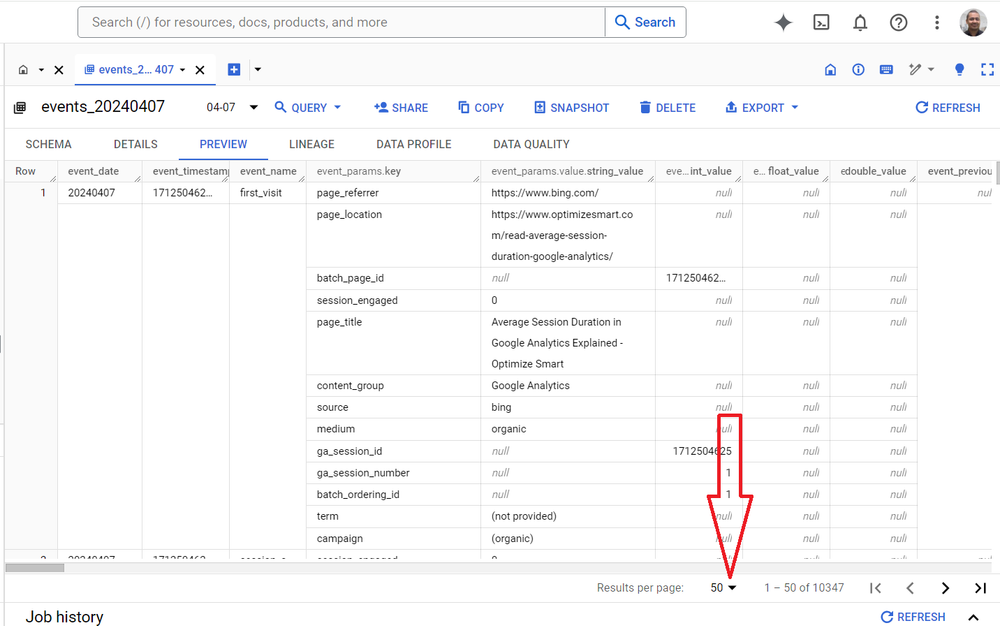
Note: You can see up to 200 rows per page.
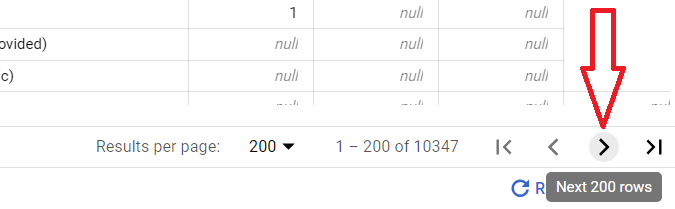
To see the next 200 rows, press the > button:
You can resize the width of each column in the data table.

How the GA4 data is stored in data tables.
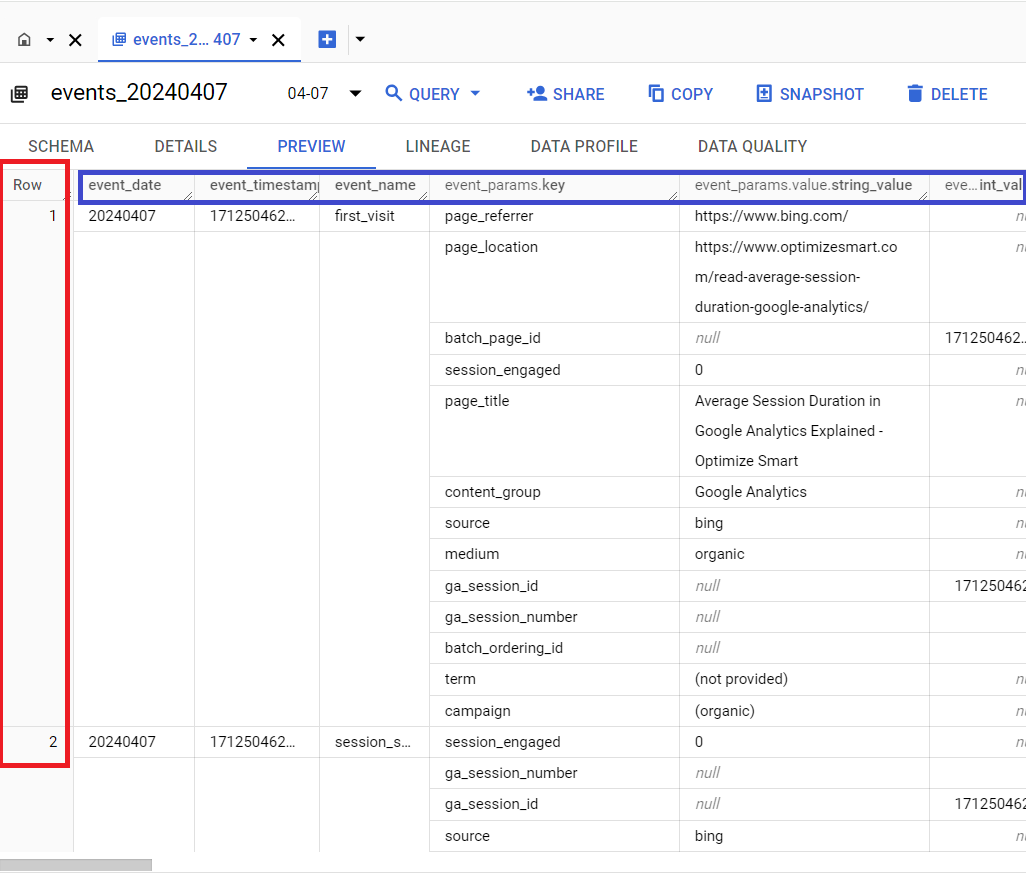
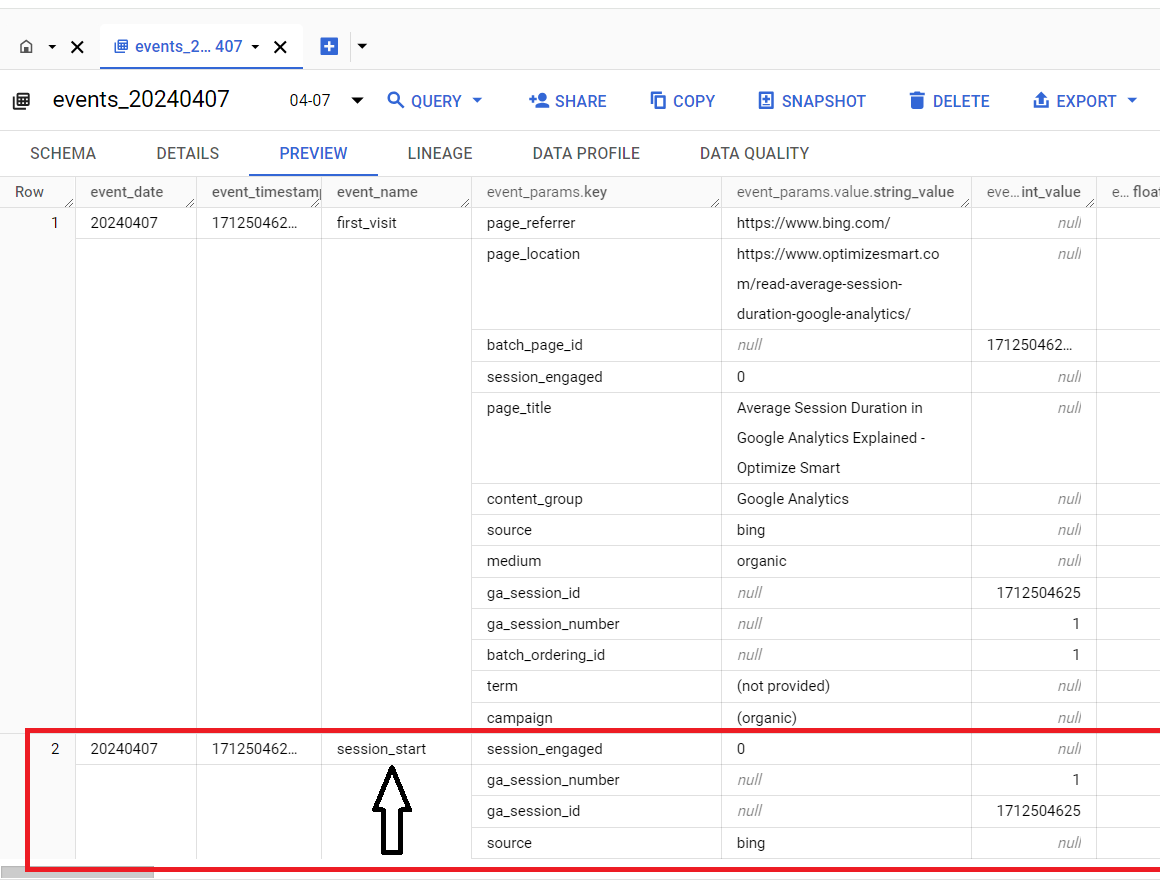
Each row of the data table corresponds to a single GA4 event.
For example,
The first row corresponds to the ‘first_visit’ event:
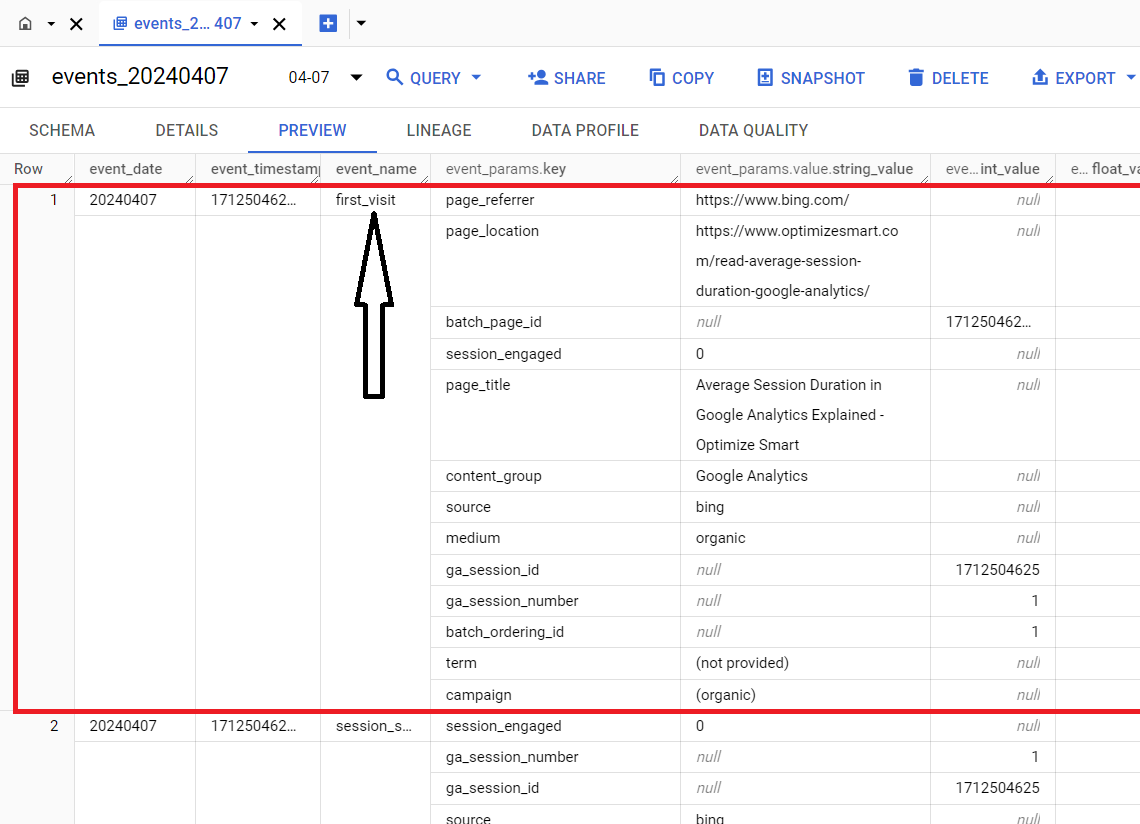
The second row corresponds to the ‘session_start’ event:
Each column of the data table corresponds to a single key of the GA4 event parameter.
Event parameters in GA4 are the additional information about an event that are sent along with the event. The key of an event parameter is the name of the parameter, and the value of an event parameter is the data associated with the parameter.
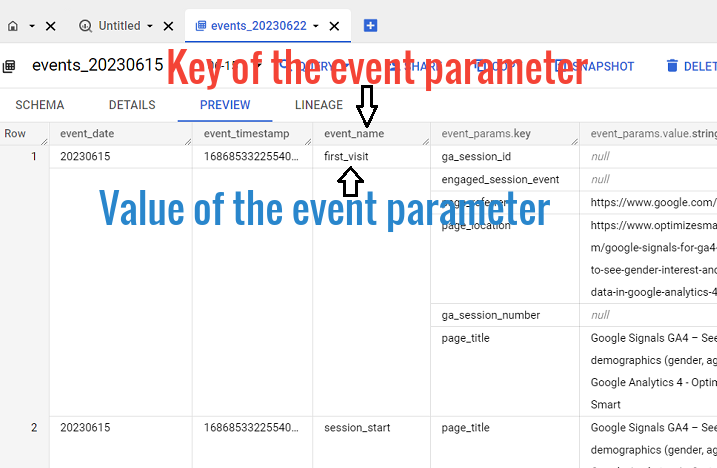
Here,
‘event_name’ is the key of the event parameter, and ‘first-visit’ is one of the values of the event parameter.
Keys are also known as fields.
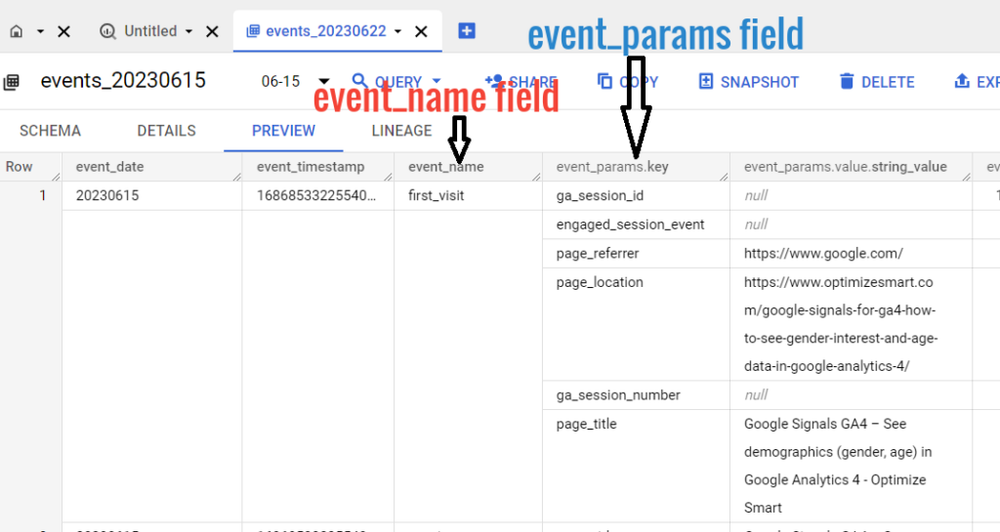
Fields can be regular or nested.
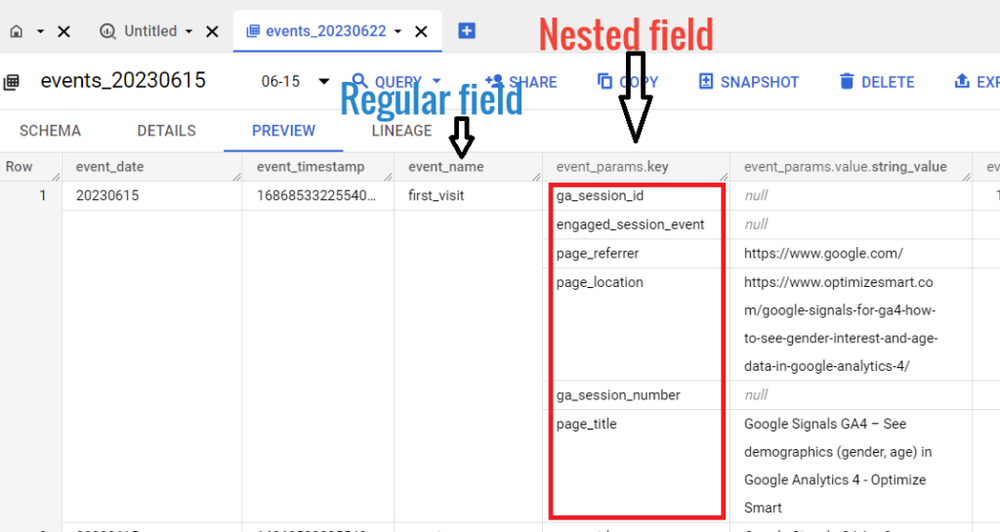
A regular field is a single piece of data, such as a string, a number, or a date. A nested field is a collection of fields (often an array of structures) that are stored together as a single unit.
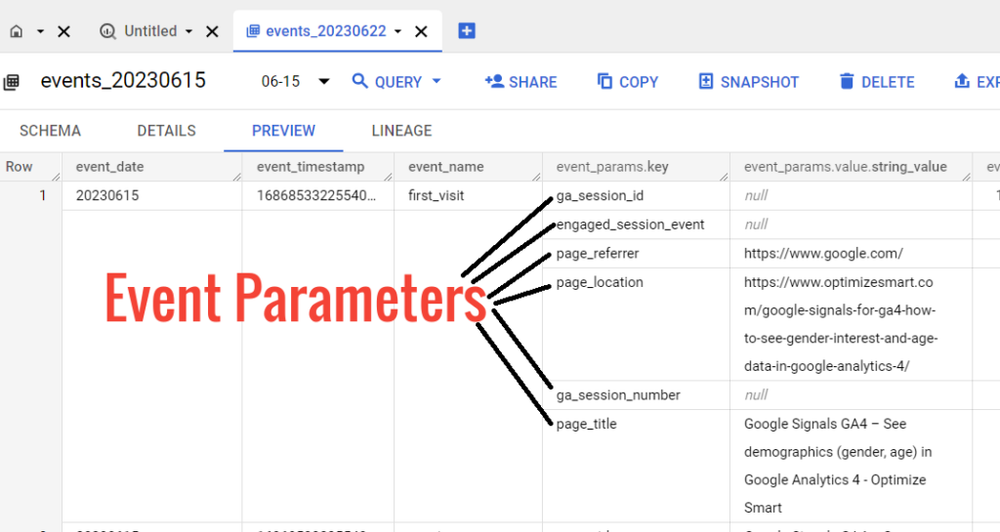
The event_params field is an array of structures that contains additional event parameters.
Here,
‘ga_session_id‘ is an event parameter.
‘engaged_session_event‘ is an event parameter.
Similarly,
‘page_title‘ is an event parameter.
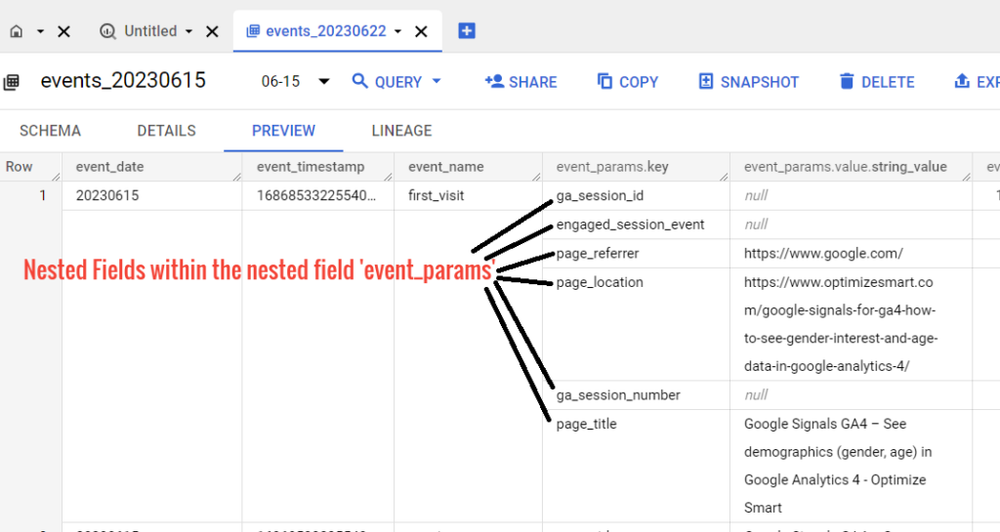
There can be nested fields within the nested field.
Nested fields can be nested within other nested fields to any depth. This is often referred to as hierarchical data.
Hierarchical data is a type of data that is organized in a tree-like structure. Each node in the tree can contain other nodes, and so on.
For example,
The ‘page_referrer’ is a nested field within the ‘event_params’ nested field.
This means that the ‘page_referrer’ event parameter is itself an array of structures. Each structure in the array represents a single referrer.
The ‘page_location’ event parameter is a nested field within the ‘event_params’ nested field.
This means that the page_location event parameter is itself an array of structures. Each structure in the array represents a single location.
Each event includes information on its specific parameters.
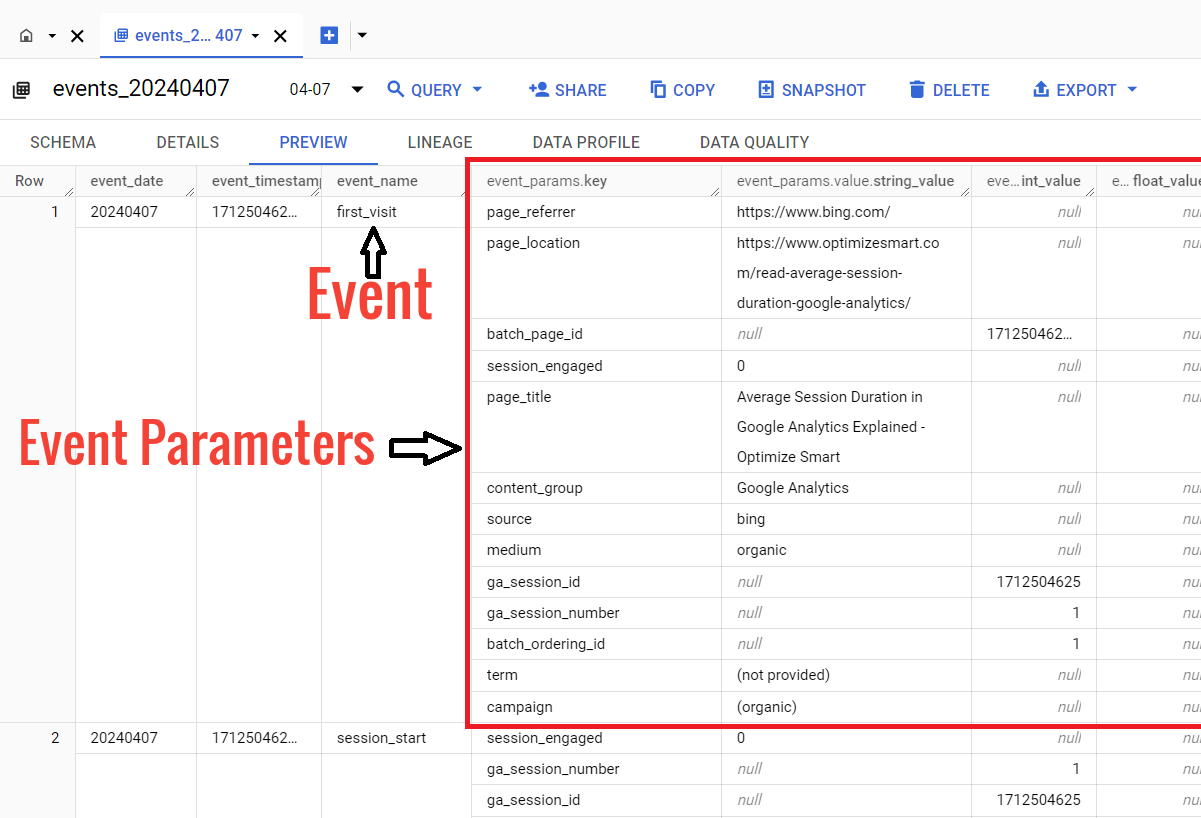
The information about GA4 event parameters is stored in the data table in the key-value format:
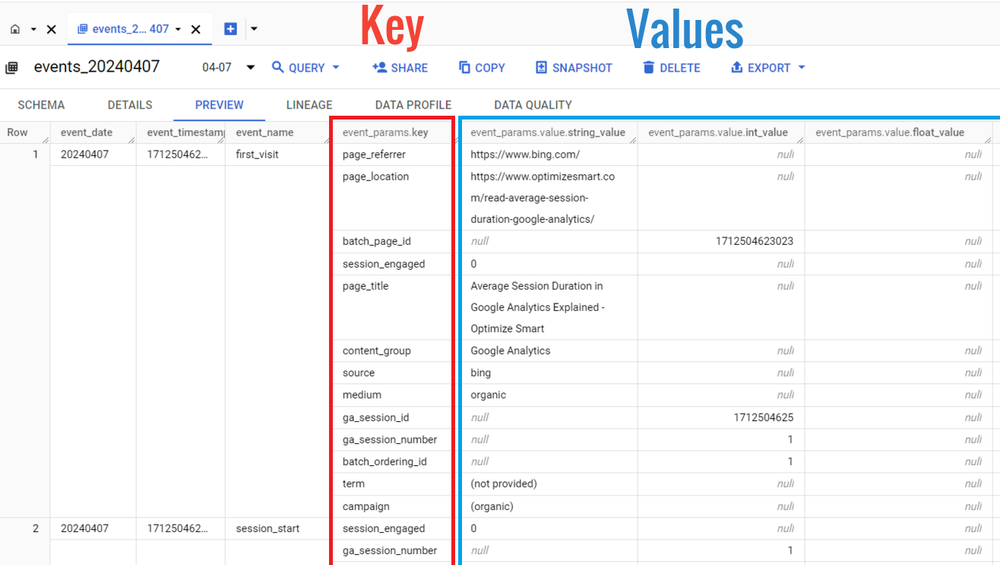
The key field (event_params.key) denotes the name of the event parameter.
For example: ‘page_title’:
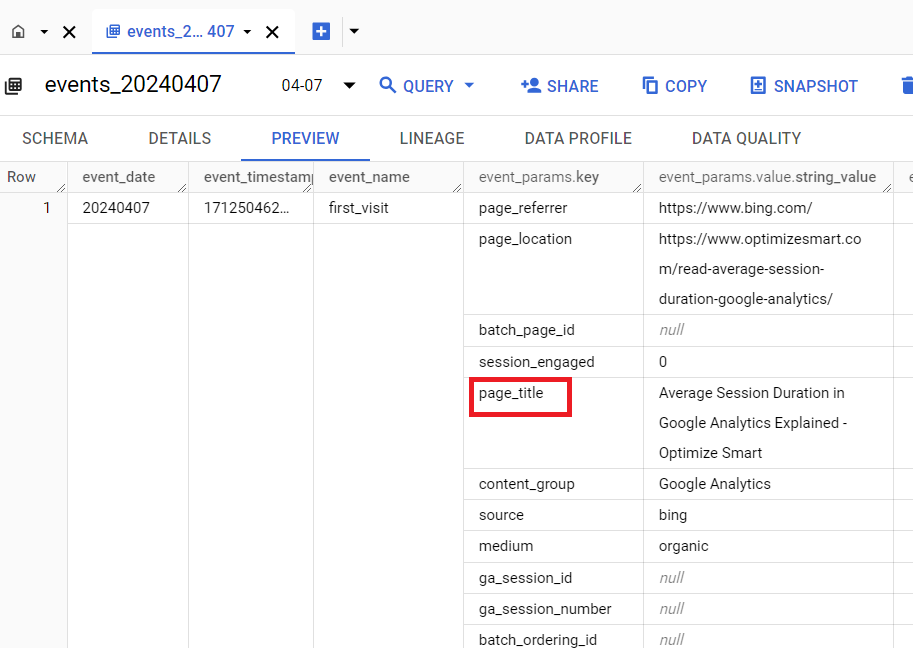
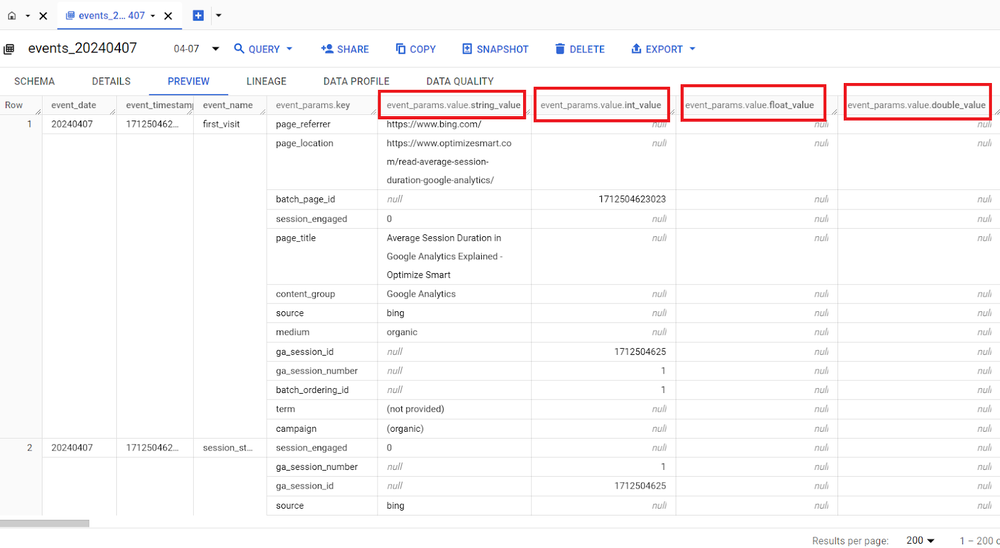
A value field is an object containing the event parameter’s value in one of its four fields:
- string_value
- int_value
- float_value
- double_value.
So we can have the following value fields:
- event_params.value.string_value
- event_params.value.int_value
- event_params.value.float_value
- event_params.value.double_value
The event_params.value.string_value field in GA4 is a nested field that stores the string value of an event parameter.
The event_params.value.int_value field in GA4 is a nested field that stores the integer value of an event parameter.
The event_params.value.float_value field in GA4 is a nested field that stores the float value of an event parameter.
The event_params.value.double_value field in GA4 is a nested field that stores the double value of an event parameter.
The specific field that is used to store the value of the event parameter depends on the type of value that the parameter is.
For example, if the event parameter is a string, the event_params.value.string_value field will be used to store the value of the parameter.
Similarly, if the event parameter is an integer, the event_params.value.int_value field will be used to store the value of the parameter. And so on.
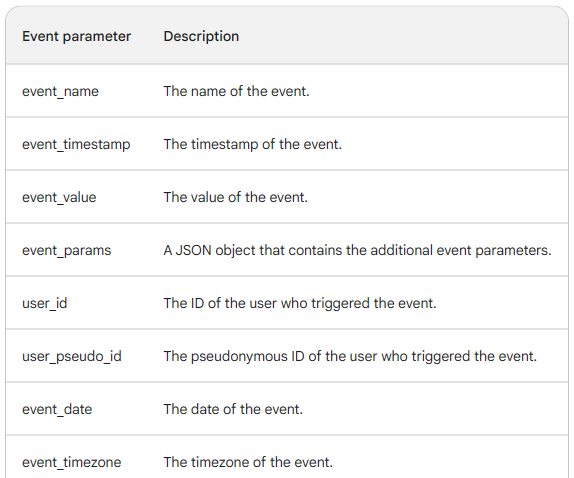
The following table lists the most common event parameters in the GA4 BigQuery data table:
Google leaves many GA4 BigQuery fields uncalculated.
Google avoids pre-calculating every GA4 dimension and metric in BigQuery to promote session-level aggregation over event-centric logic.
If I create a custom schema for the GA4 BigQuery data table that provides pre-calculated fields for every possible corresponding GA4 dimension and metric as top-level columns (rather than buried inside ‘event_params’), I am encouraging you to rely on fully event-centric logic.
You may think I am providing you with the option to be more efficient and flexible.
And you are right, but as long as you are working with small datasets.
However, since you will be working at the event level, your queries will process all event rows repeatedly, which is inefficient for large datasets.
So, for large datasets (>1M rows), event-centric logic is highly inefficient.
And BigQuery is not primarily designed for small datasets. It is a data warehouse meant for large and very large datasets.
If I don’t provide you with pre-calculated fields for every possible corresponding GA4 dimension and metric, you will have no choice but to rely on session-level aggregation.
Since event data is aggregated to session-level data first, all later steps operate on a much smaller dataset. This is significantly faster and more efficient for large datasets.
I guess that is why Google does not provide pre-calculated fields for every possible corresponding GA4 dimension and metric.
You should not rely too much on pre-calculated fields when dealing with large and very large datasets to make your queries faster and more cost-efficient.
Related Articles:
- GA4 to BigQuery Mapping Tutorial.
- Understanding the BigQuery User Interface.
- GA4 BigQuery Query Optimization.
- How to access a nested field in GA4 BigQuery data table.
- How to Calculate Unique Users in GA4 BigQuery.
- GA4 BigQuery Export Schema Tutorial.
- Calculating First Time Users in GA4 BigQuery.
- Extracting Geolocations in GA4 BigQuery.
- GA4 BigQuery SQL Optimization Consultant.
- Tracking Pages With No Traffic in GA4 BigQuery.
- First User Primary Channel Group in GA4 BigQuery
- How to handle empty fields in GA4 BigQuery.
- Extracting GA4 User Properties in BigQuery.
- Calculating New vs Returning GA4 Users in BigQuery.
- How to access BigQuery Public Data Sets.
- How to access GA4 Sample Data in BigQuery.