Google BigQuery is a product of the Google Cloud Platform.
BigQuery is a data storage and management system used to consolidate data from multiple sources for reporting and analysis.
Following is the visual walkthrough of the BigQuery User Interface:
Following is the home page of the Google Cloud Console, which you can access by navigating to https://console.cloud.google.com/
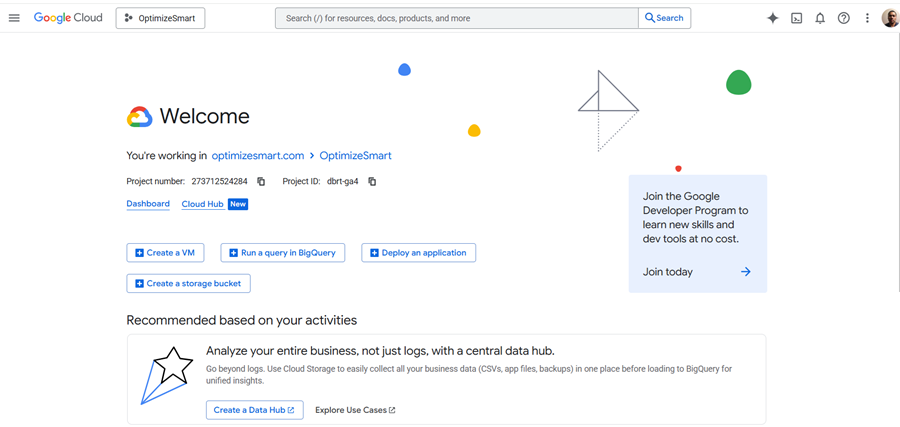
You can also access the home page of the Google Cloud Console by clicking on the ‘Google Cloud’ icon:
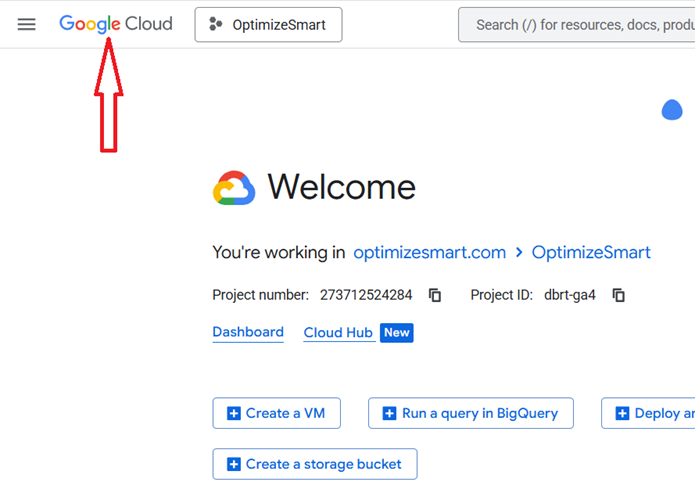
Google Cloud Platform (GCP) can consist of one or more organizations:
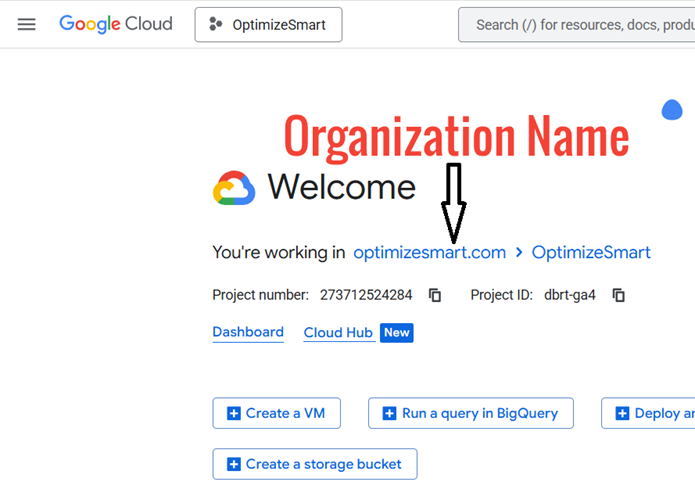
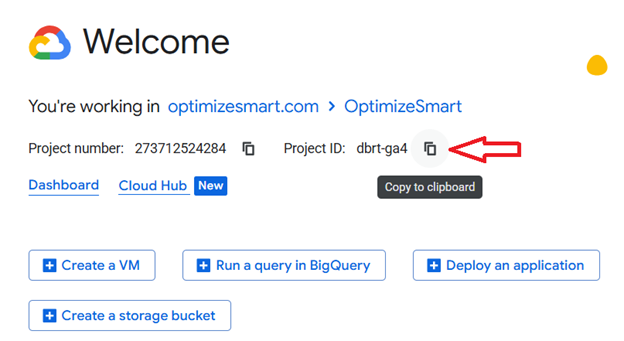
Each organisation can consist of one or more projects. Each project has a project name, Project number and project ID:
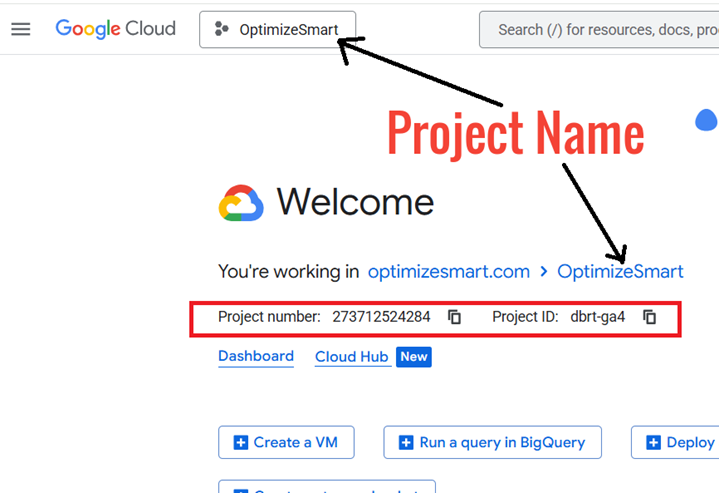
A project consists of a set of users, a set of APIs, billing, authentication and monitoring settings for those APIs.
API is a mechanism that allows two pieces of software (like BigQuery and GA4) to communicate with each other.

If you want to copy the project ID, then click on the copy button next to it:
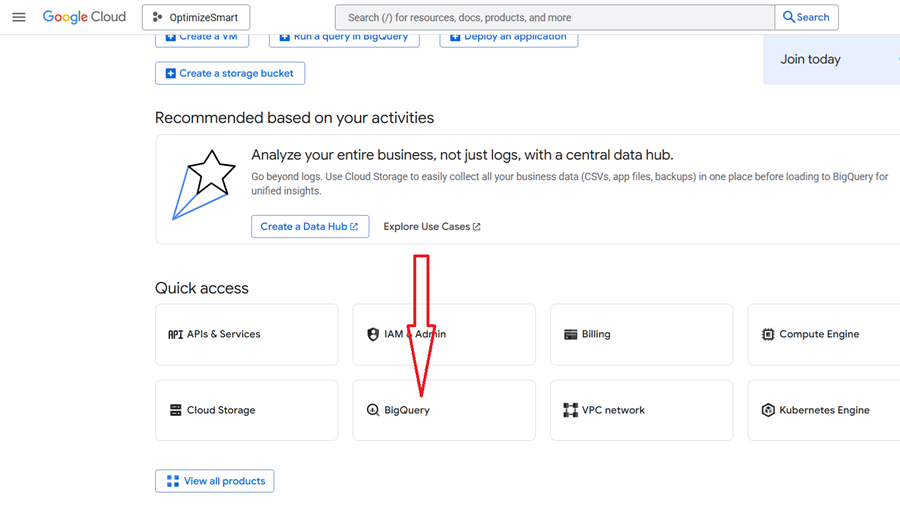
Click on the ‘BigQuery’ button under ‘Quick Access’ to quickly access the BigQuery Studio (aka SQL Workspace):
This is what BigQuery Studio looks like:
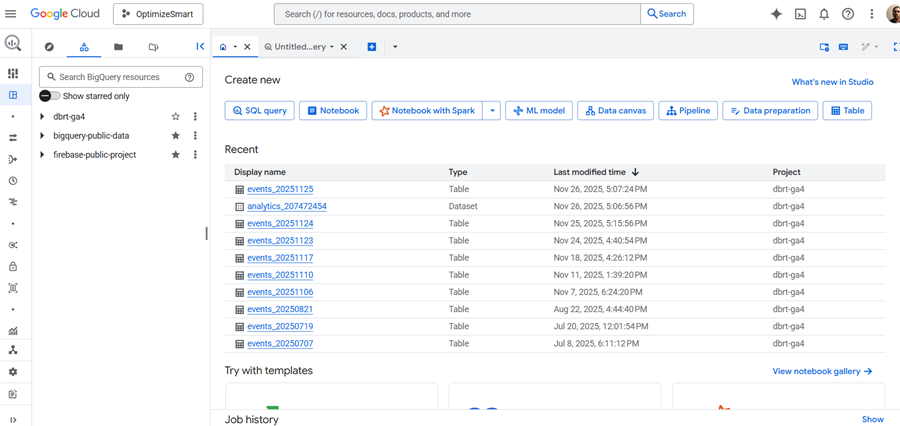
The BigQuery Studio is the primary tool for interacting with BigQuery and performing data analysis tasks.
Most of the time, you will find yourself working here.
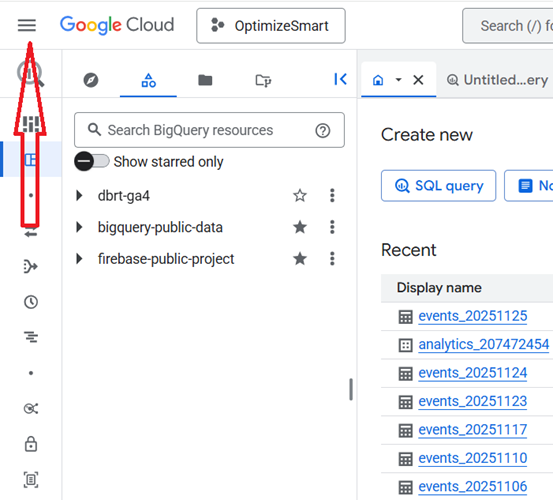
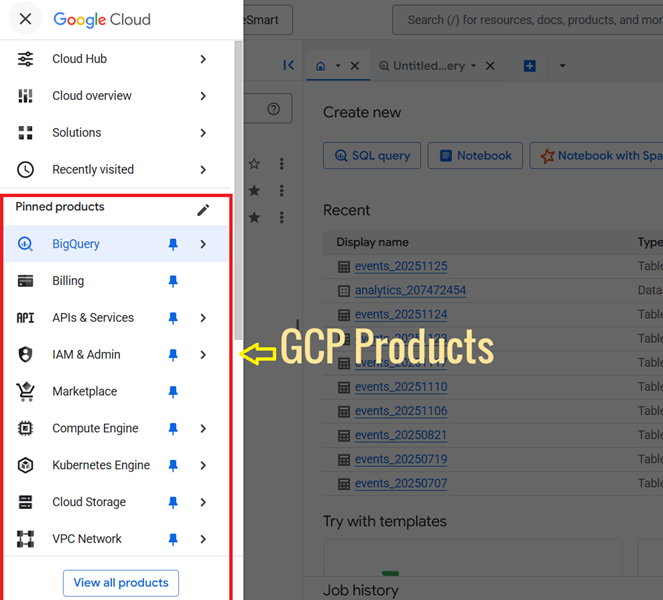
Click on the hamburger menu to see all the GCP products:
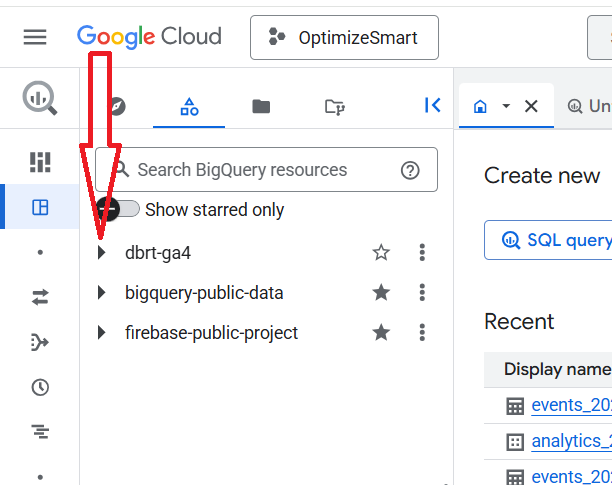
A project can consist of one or more datasets.
When you click on the project ID, you can see the datasets:
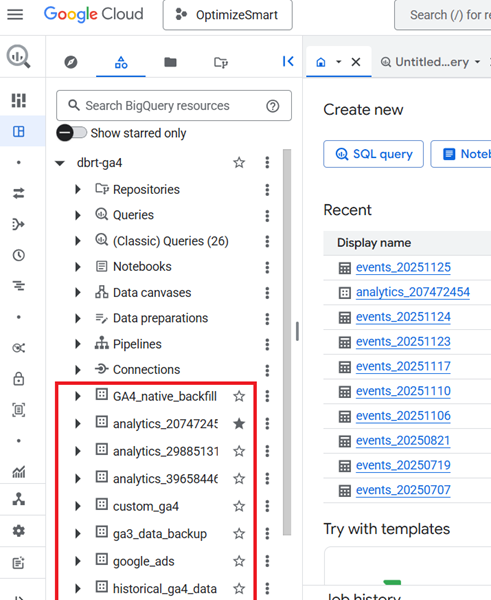
Here, the project id ‘dbrt-ga4’ contains the following data sets:
- GA4_native_backfill.
- analytics_207472454
- analytics_29885131
- analytics_39658446
- custom_ga4
- ga3_data_backup
- google_ads
- historical_ga4_data etc

The dataset name is in the following format: “analytics_<property_id>” is the dataset meant for GA4:
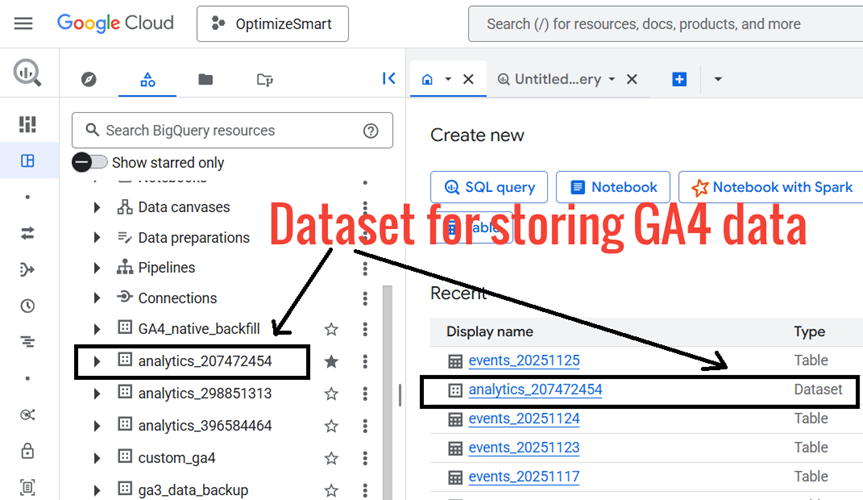
Click on the dataset named in the following format: “analytics_<property_id>” .
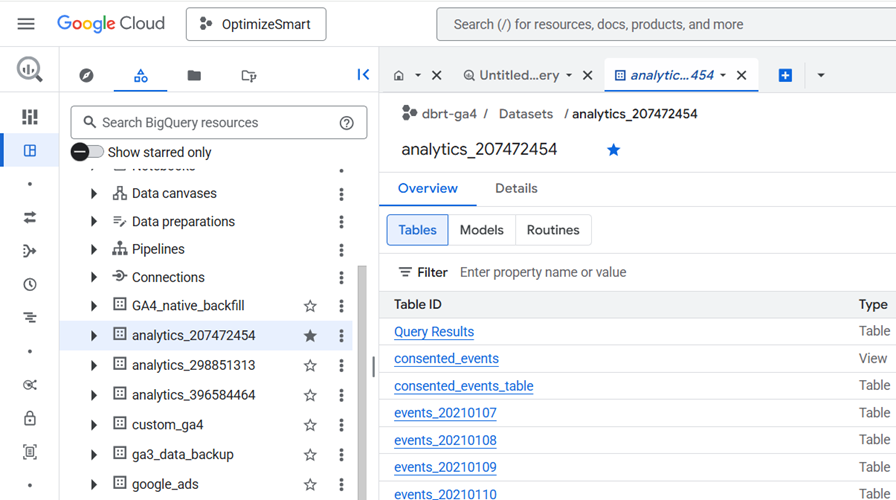
Click on the ‘Details’ tab:
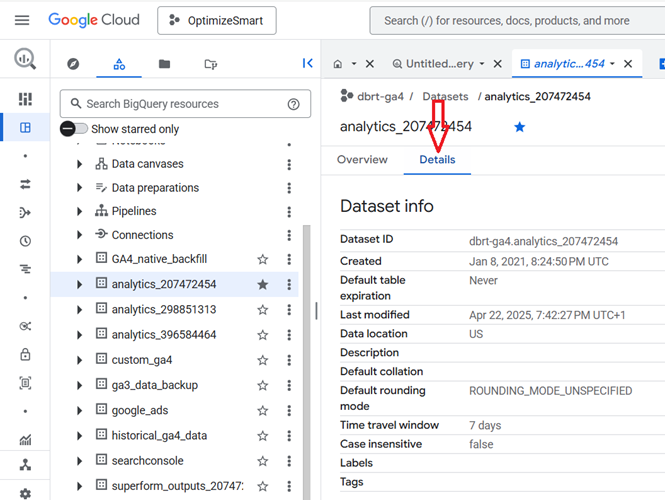
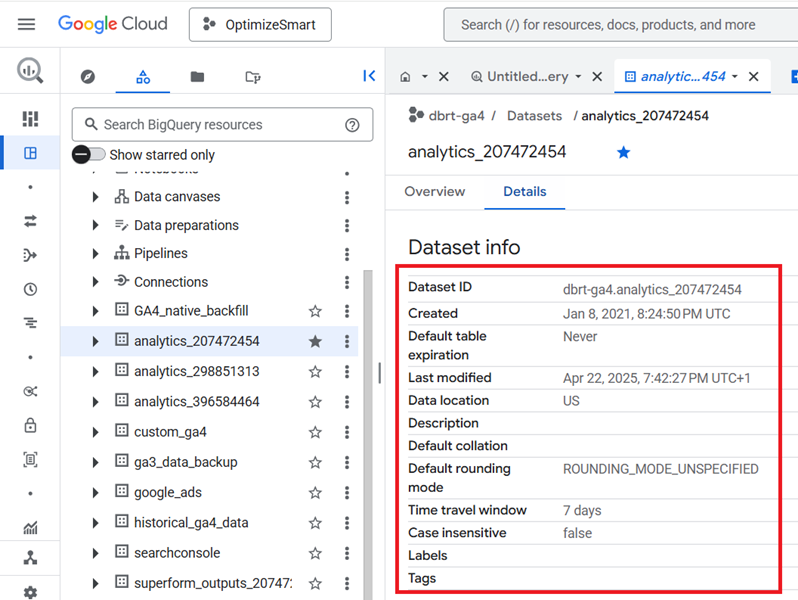
You should now be able to see the dataset information like: ‘Dataset ID’, Dataset creation date, Last modification date, Data location etc:
Note down the Dataset ID by copying it to the clipboard:
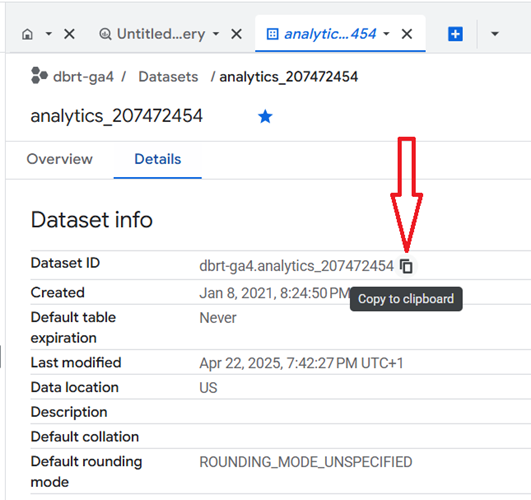
We are going to reference this dataset ID later when querying the data.
Click on the ‘analytics_’ dataset again.
You should now see data tables:
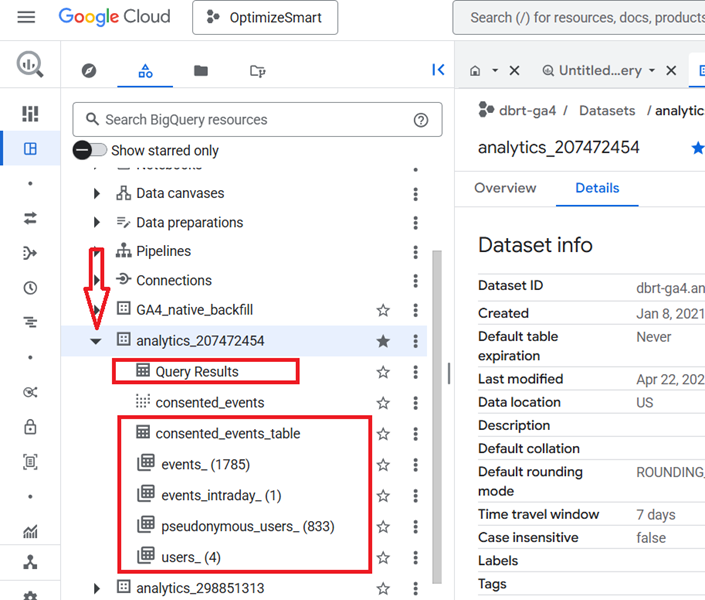
Each data set is made up of one or more data tables.
The ‘analytics_207472454’ dataset contains the following 6 data tables:
- Query Results.
- consented_events_table.
- events_(<number of days>)
- events_intraday_<number of days>
- pseudonymous_users_<number of days>
- users_<number of days>
The ‘events_’ and ‘events_intraday_’ data tables contain event-based and user-based GA4 export data in BigQuery.
Whereas the ‘pseudonymous_users_’ and ‘users _’ data tables contain only user-based GA4 export data in BigQuery.
The advantage of using the ‘pseudonymous_users_’ and ‘users _’ data tables over the ‘events_’ and ‘events_intraday_’ data tables is that you get access to more user data.
The ‘pseudonymous_users_’ and ‘users _’ data tables contain audience and prediction data which is not available in the ‘events_’ and ‘events_intraday_’ data tables.
All the GA4 event data from the previous day(s) is available in the ‘events_’ data table.
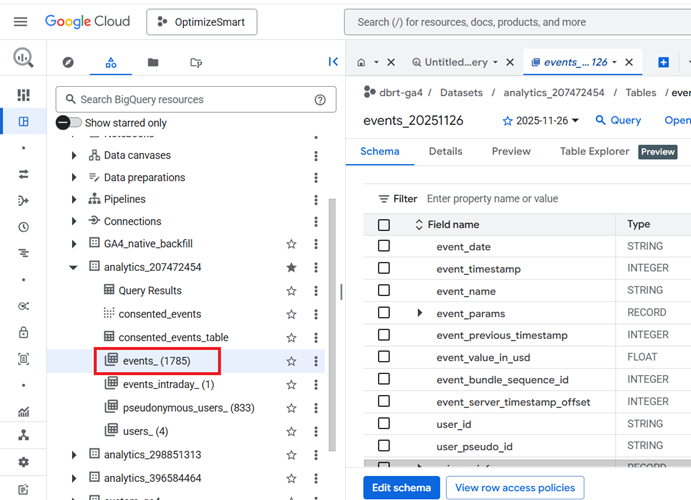
This table is automatically imported for each day of export.
events_(1) means all of the GA4 event data from the previous day are available in this data table.
events_(2) means all of the GA4 event data from the previous two days are available in this data table.
events_(3) means all of the GA4 event data from the previous three days are available in this data table.
Similarly,
events_(1785) means all of the GA4 event data from the previous 1785 days are available in this data table.
All the GA4 event data from the current day is available in the ‘events_intraday_’ data table.
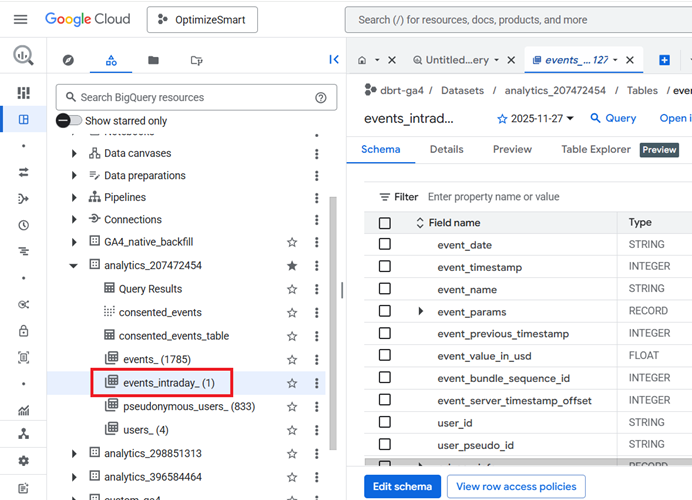
This table is automatically updated throughout the day. That’s why it is called ‘events_intraday’ table.
Note: We usually do not query GA4 data from the ‘events_intraday_’ data table.
The ‘pseudonymous_users_’ data table contains all the data for every pseudonymous identifier that is not user ID.
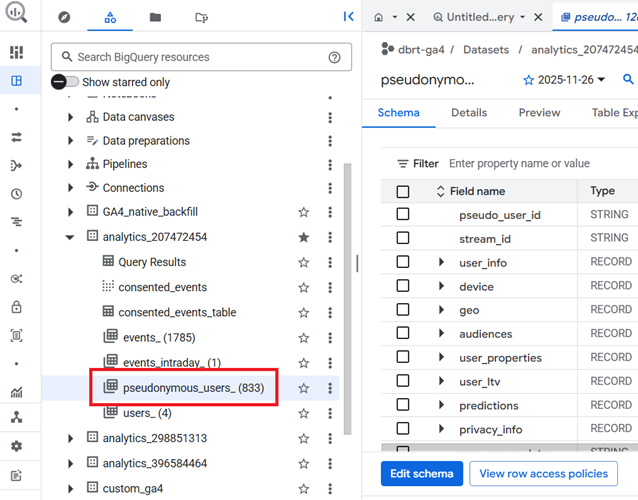
A pseudonymous identifier is a unique identifier (like ‘Google Signals’ or ‘Device ID’) created and assigned to each user by Google Analytics to track users across devices and sessions and to create a complete picture of their behaviour.
The ‘pseudonymous_users_’ data table is updated whenever data for a user is updated.
pseudonymous_users_(1) means all the data for every pseudonymous identifier that is not a user ID from the previous day is available in this data table.
pseudonymous_users_(2) means all the data for every pseudonymous identifier that is not a user ID from the previous two days is available in this data table.
Similarly,
pseudonymous_users_(833) means all the data for every pseudonymous identifier that is not a user ID from the previous 236 days is available in this data table.
The ‘users_’ data table contains all the data for every pseudonymous identifier that is a user ID.
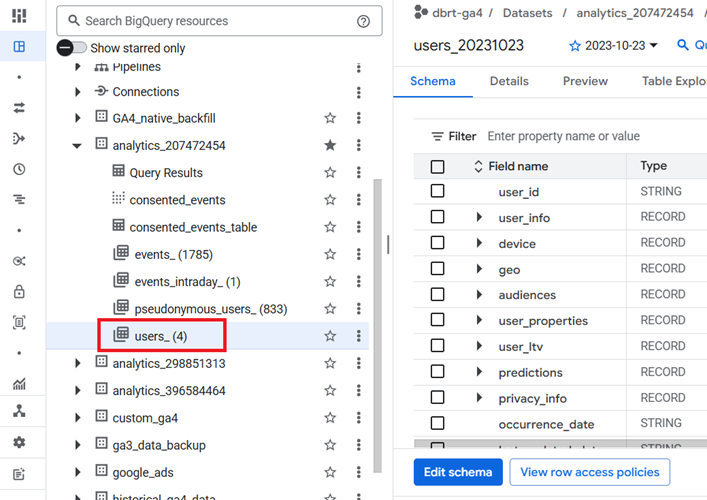
Data for a user is updated when there is a change to one of the fields.
Note: The ‘users_’ data table is not available to you in your BigQuery project if you are not using the user-id tracking in GA4.
Clicking on the ‘events_’ data table will show you the structure of that table (also known as ‘Schema’):
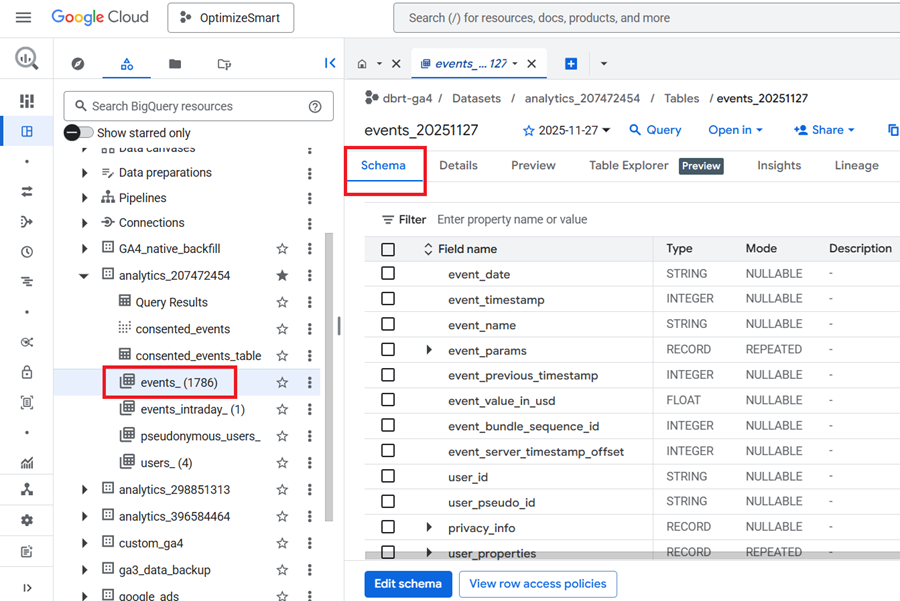
The schema shows you how the data table has been set up, what type of values it accepts, etc.
Take a close look at the various fields available under the ‘SCHEMA’ tab:
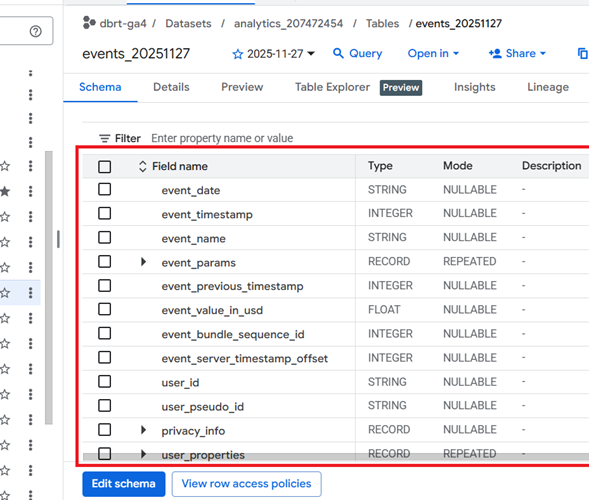
We will reference these fields when querying the GA4 data.
Bookmark the [GA4] BigQuery Export schema help documentation from Google to find more information about each field:
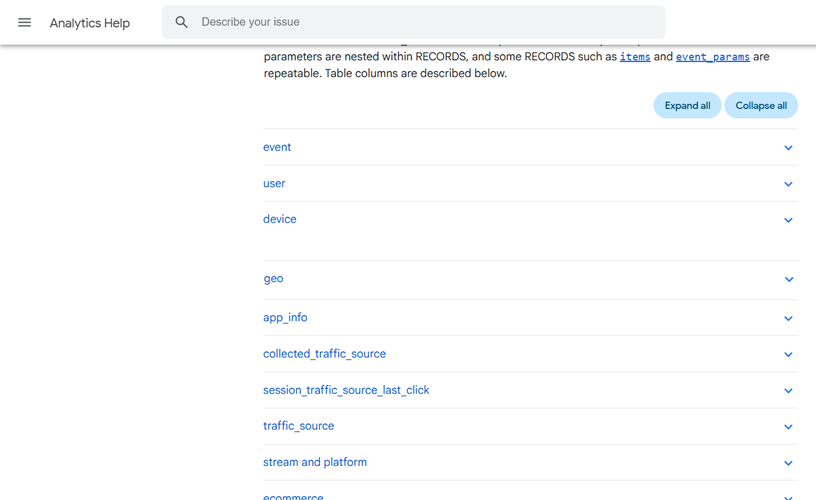
You can increase or decrease the size of the right-hand side panel by dragging via the mouse:
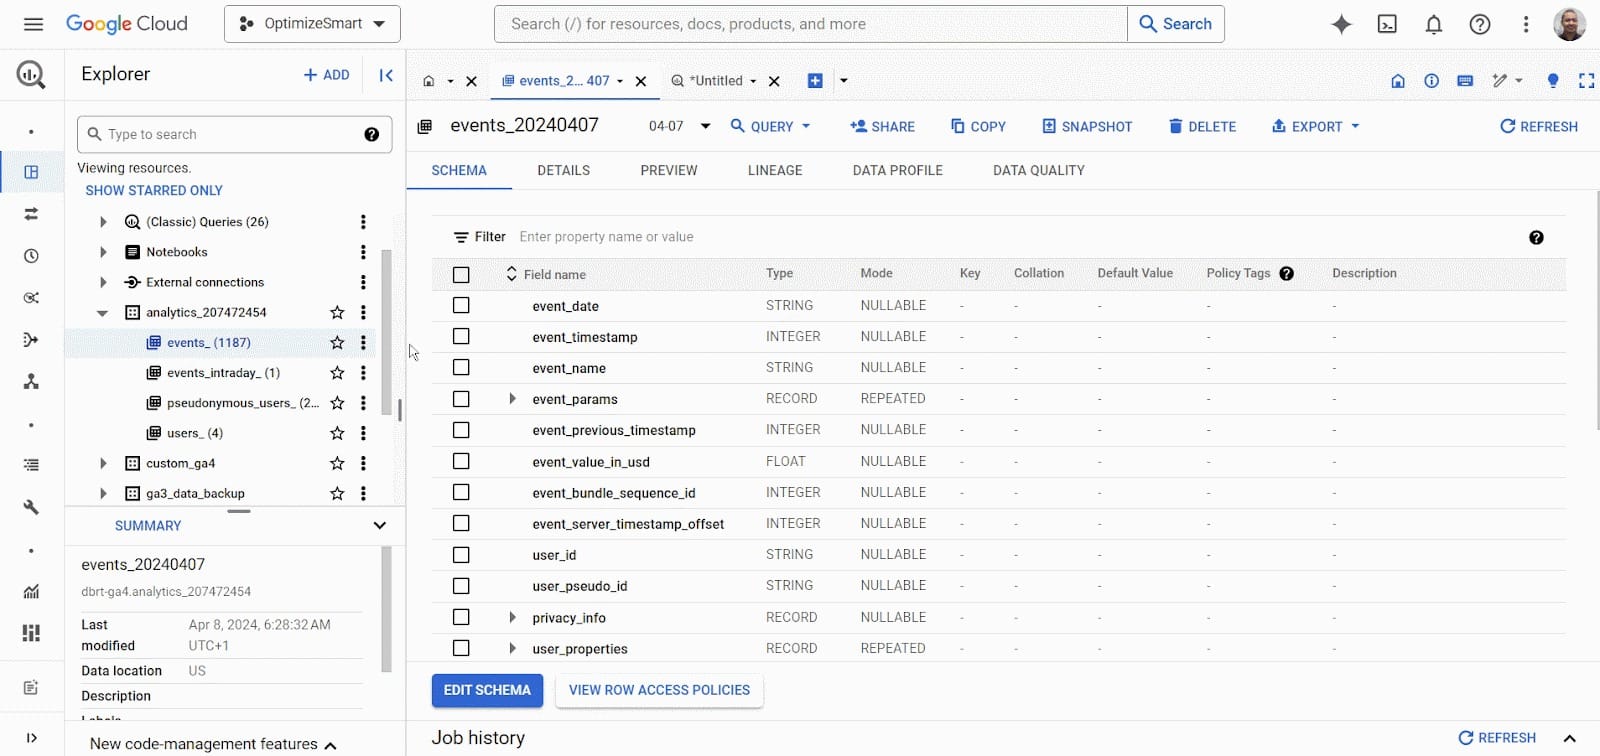
The ‘events_’ data tables are named as “events_YYYYMMDD” where “YYYYMMDD” refers to the date the table was imported to BigQuery.
YYYY denotes a year. For example, 2025
MM denotes a month. For example, 11 (i.e. November)
DD denotes a day. For example, 28
So the data table that was imported to BigQuery on Nov 28th, 2025 would be named as events_20251128
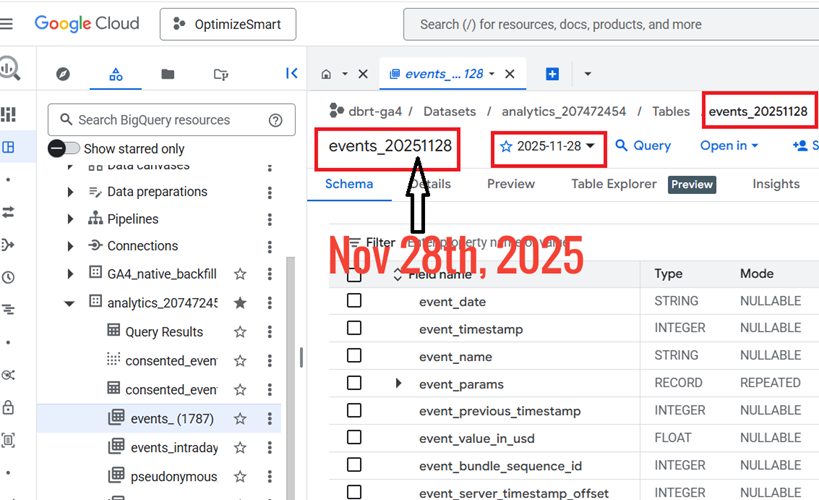
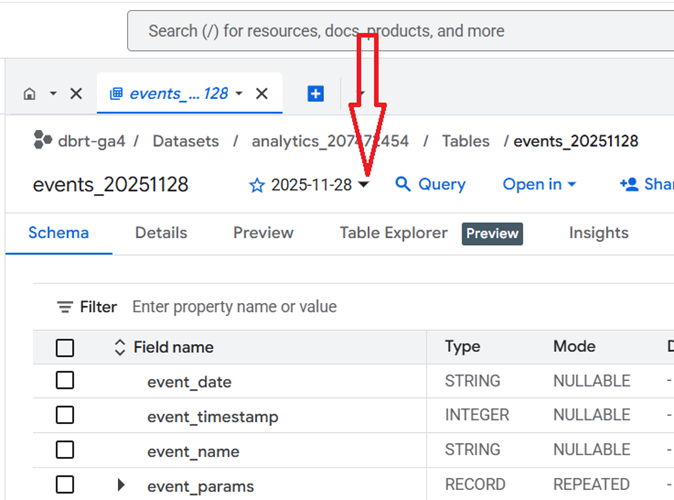
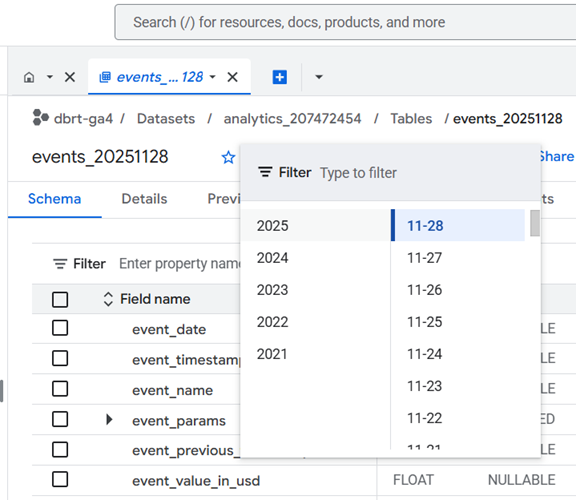
So you are looking at the data for Nov 28th, 2025.
If you want to look at data for a different date, then click on the date drop-down menu and select a different date:
Click on the ‘DETAILS’ tab to get information about the data table:
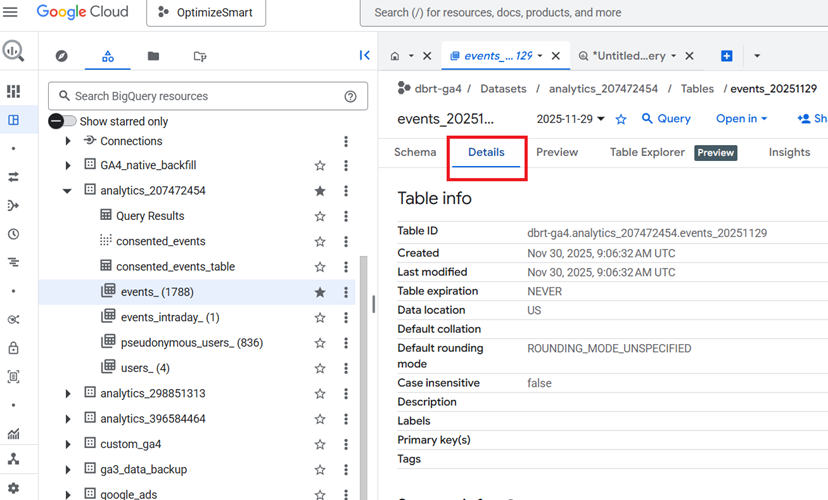
Take note of the table ID:
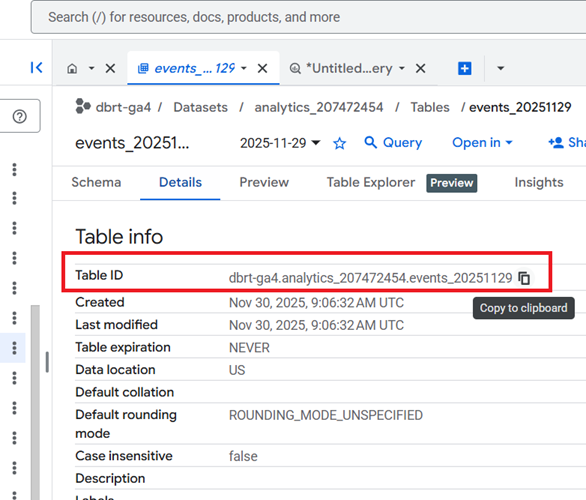
We will reference the table ID later when querying the GA4 data.
Look at the ‘Storage Info’ section to determine the size of your data table:
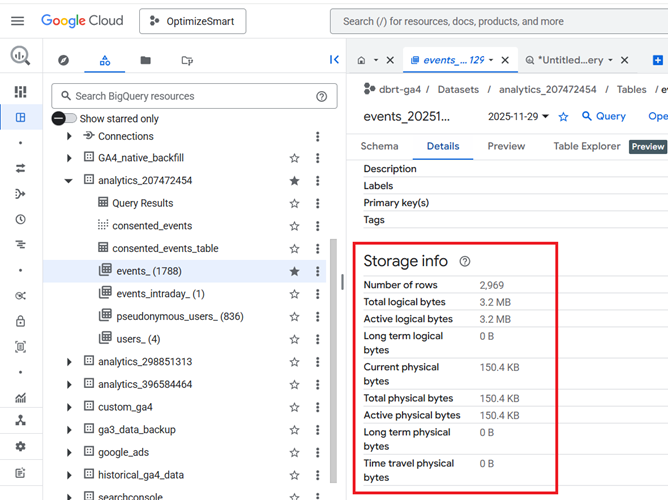
It is always best practice that before you query the data from a table, you check the size of the table.
If the size of the data table is just a few kilobytes (KB) or megabytes (MB), you don’t need to worry.
But if the table size is in gigabytes (GB), terabytes (TB) or petabytes (PB), you should be careful how you query your data.
Your monthly cost of using BigQuery depends upon the following factors:
#1 The amount of data you store in BigQuery (i.e. the storage cost)
#2 The amount of data you processed by each query you run (i.e. the query cost).
The first 10 GB of active storage is free each month. After that, you would be charged $0.020 per GB of active storage.
The first 1 terabyte of data processed is free each month. After that, you would be charged $5 per terabyte (TB) of data processed.
Click on the ‘Preview’ tab to view the actual data in the ‘events_’ data table:
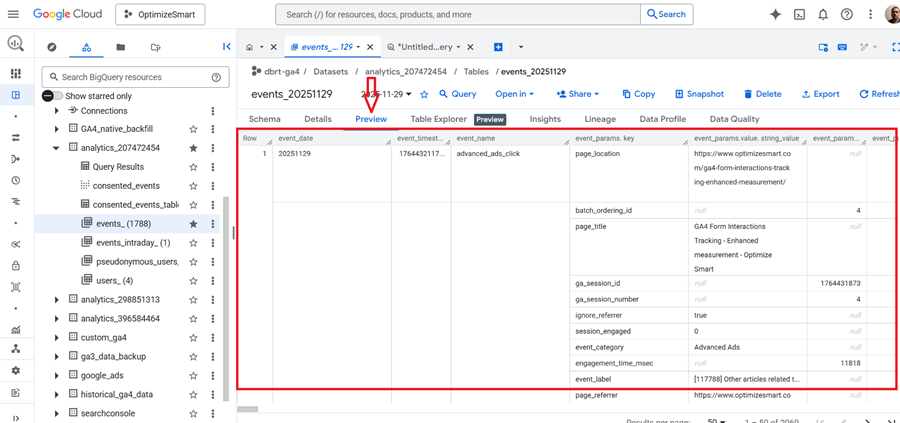
It is always best practice that before you query the data from a table, you preview the table.
Many people, especially new users, run queries just to preview the data in a data table.
This could considerably cost you if you accidentally queried gigabytes or terabytes of data.
Instead of running queries just to preview the data in a data table, click on the ‘Preview’ tab to preview the table.
There is no cost for previewing the data table.
The table preview will give you an idea of what type of data is available in the table without querying the table.
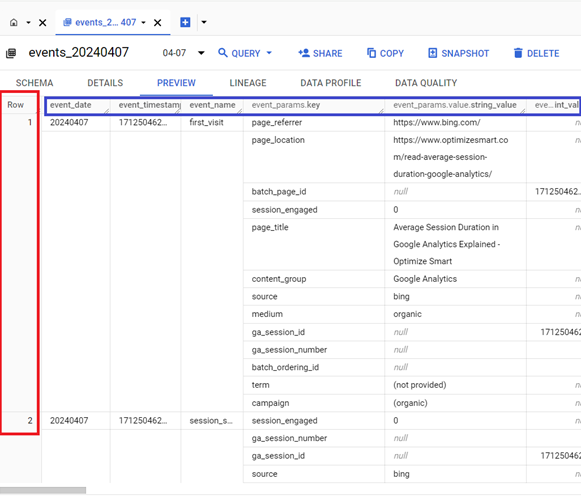
From the table preview, you can see that the table is made up of rows and columns:
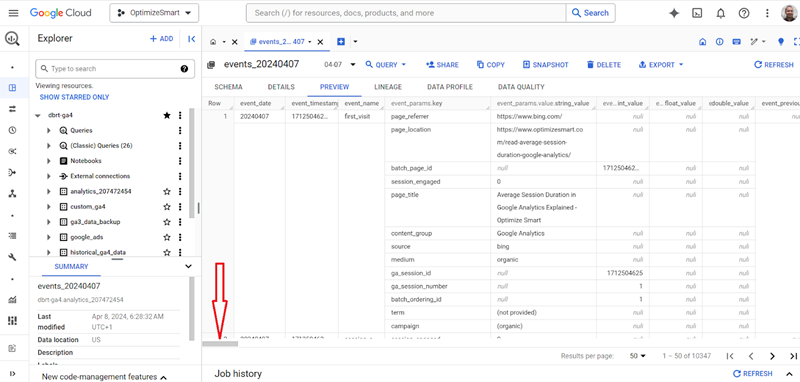
Use the horizontal slider to see more columns:
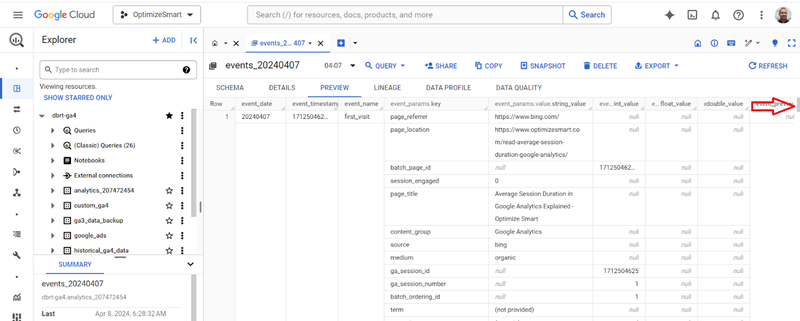
Use the vertical slider to see more rows:
Use the ‘Results per page’ drop-down menu if you want to see more than 50 rows:
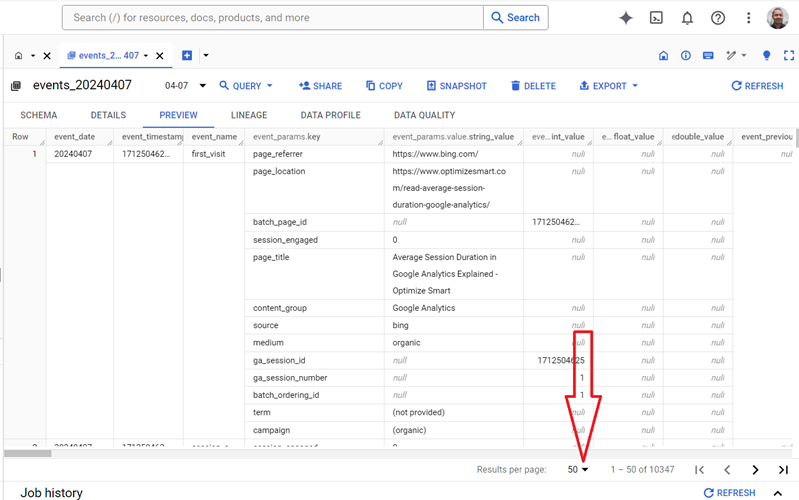
Note: You can see up to 200 rows per page.
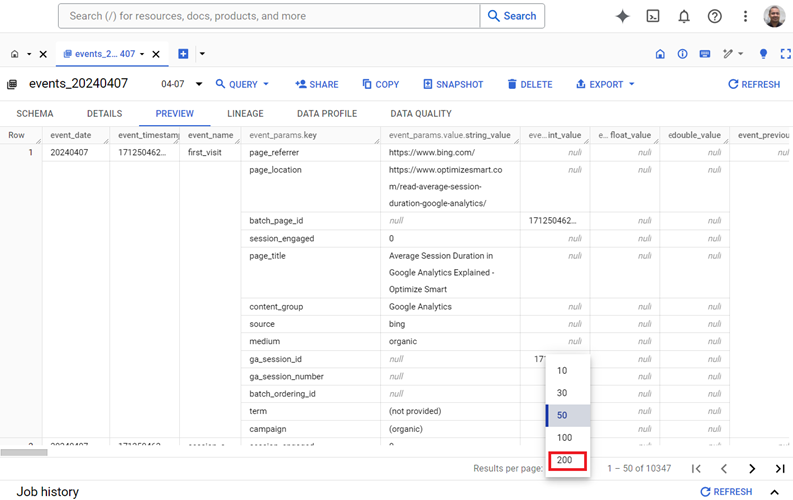
To see the next 200 rows press the > button:

You can re-size the width of each column in the data table.
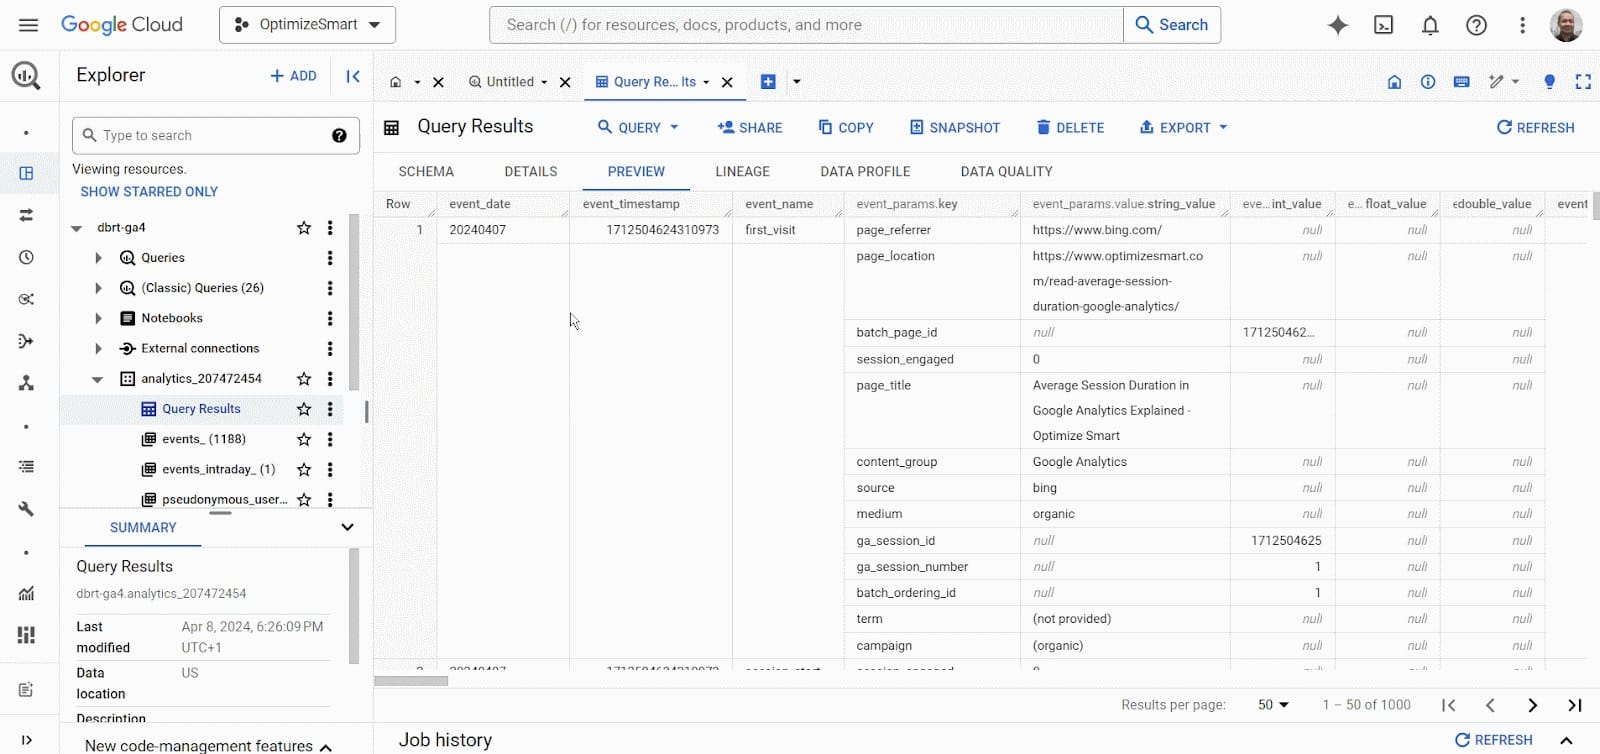
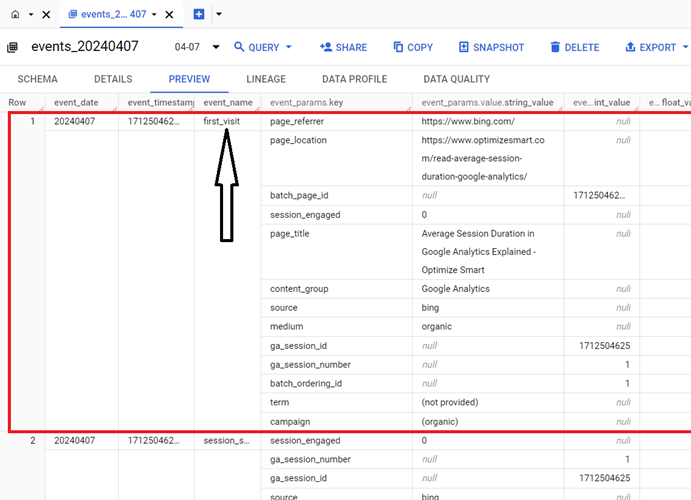
Each row corresponds to a single GA4 event.
For example, the first row corresponds to the ‘first_visit’ event:
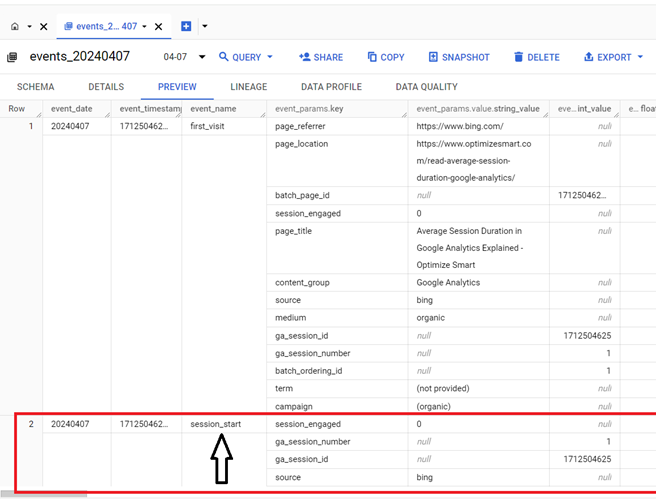
The second row corresponds to the ‘session_start’ event:
Each event has information on event-specific parameters.
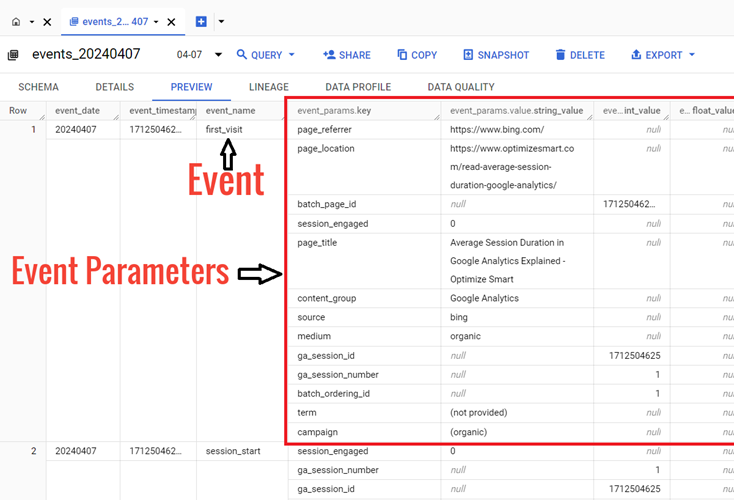
Event parameters in GA4 are the additional information about an event that is sent along with the event.
The information about GA4 event parameters is stored in the data table in the key-value format:
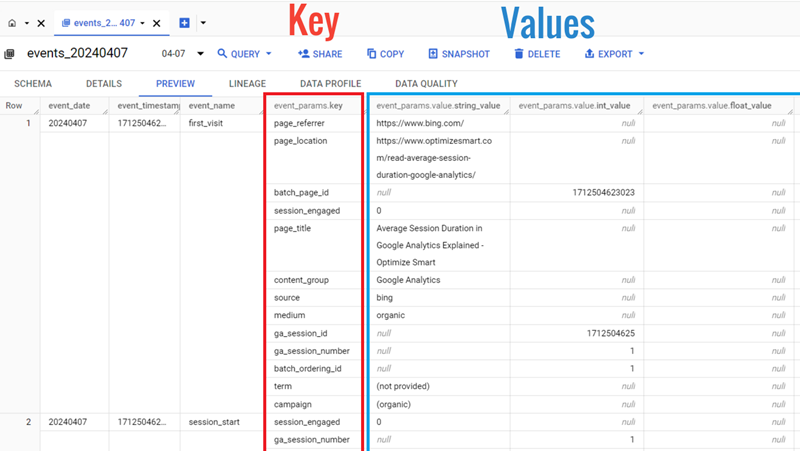
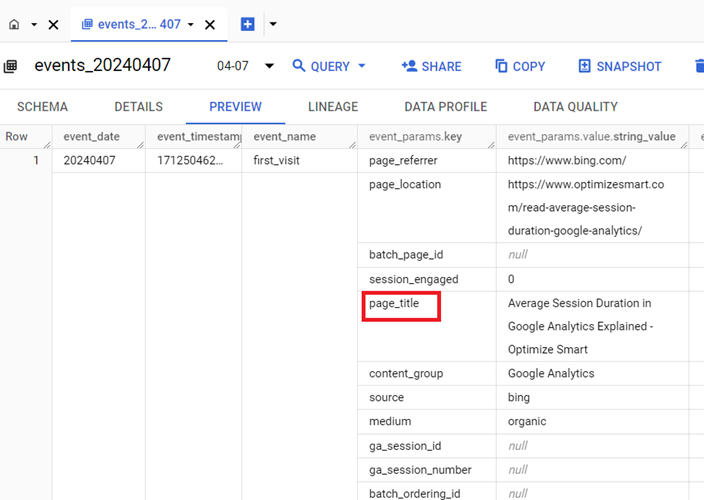
The key field (event_params.key) denotes the name of the event parameter.
For example: ‘page_title’:
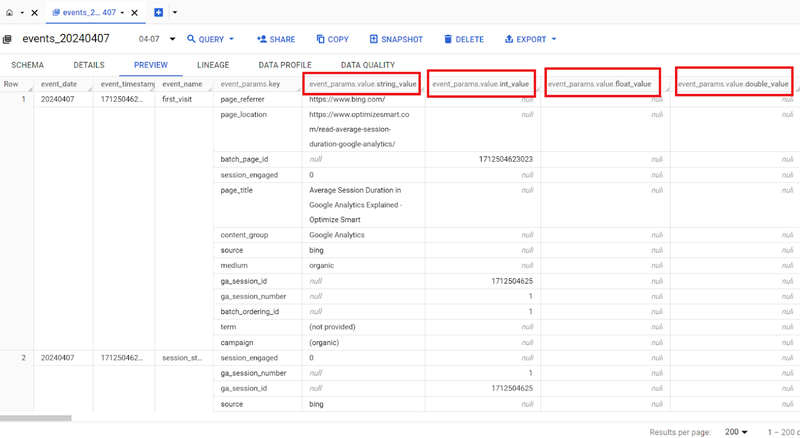
A value field is an object containing the event parameter’s value in one of its four fields:
- string_value
- int_value
- float_value
- double_value.
So we can have the following value fields:
- event_params.value.string_value
- event_params.value.int_value
- event_params.value.float_value
- event_params.value.double_value
Once you understand how GA4 data is stored in data tables, it will be easier to query it.
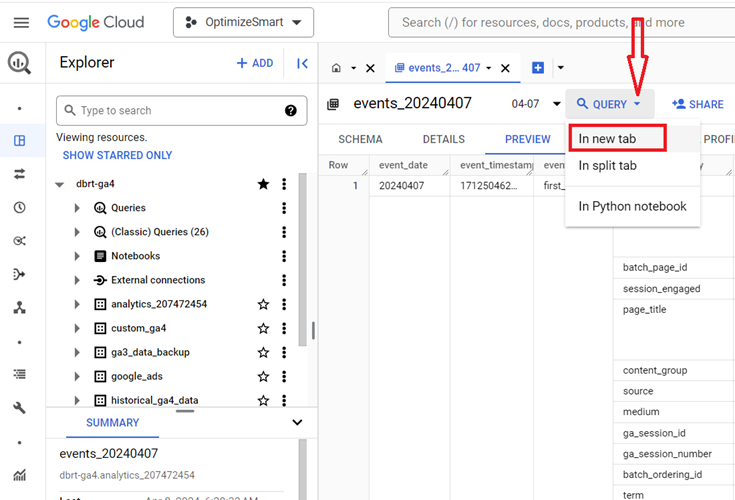
Click on the ‘Query’ drop-down menu and then click on the ‘In new tab’ to query the ‘events_’ data table
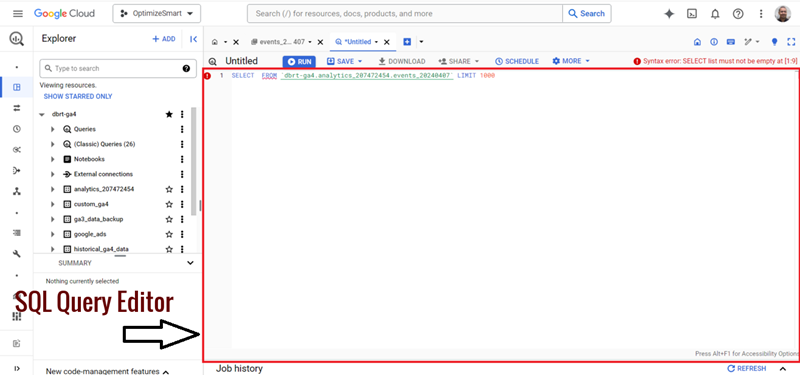
You should now see the SQL Query Editor, where you can run SQL queries:
Following is an example of an SQL query:
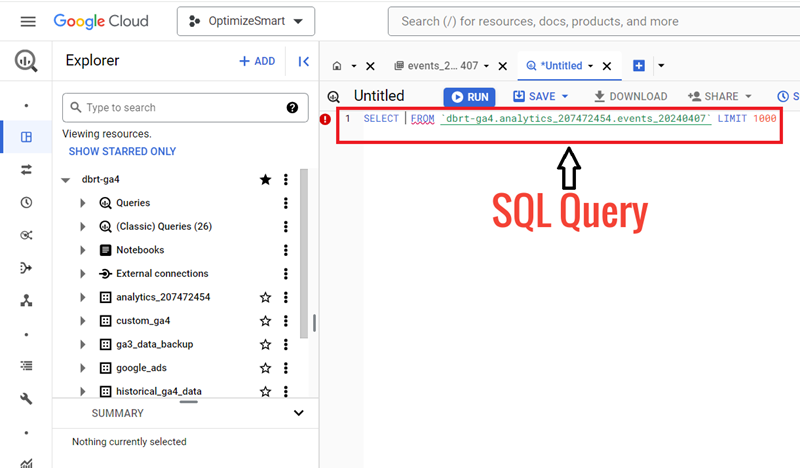
This query is pre-populated for you but contains a syntax error.
The details about the type of error are mentioned on the top right-hand side of your screen:
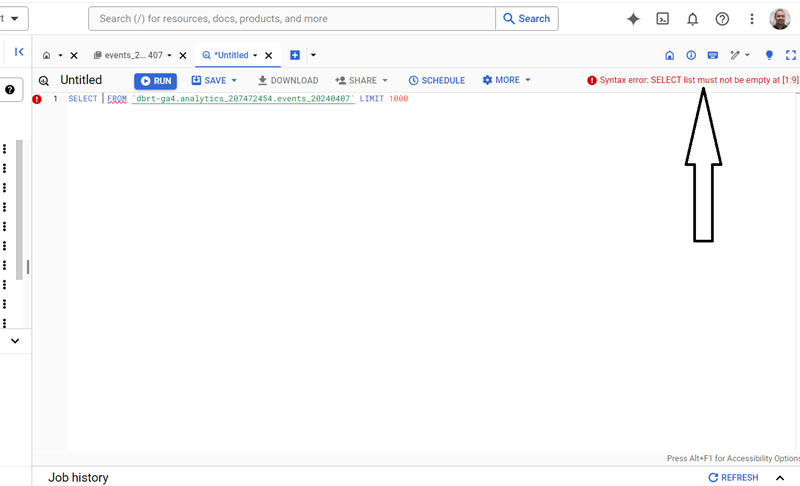
We are getting syntax errors because we have not specified the column(s) from which to pull the data.
Let’s retrieve all the columns of the table by typing the character * next to the SELECT keyword:
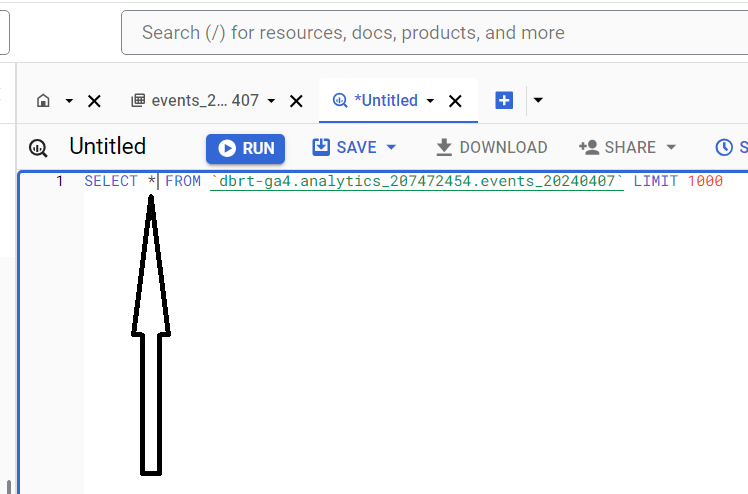
You can check how much data your query will process before you run your query by looking at the top right-hand side of your screen:
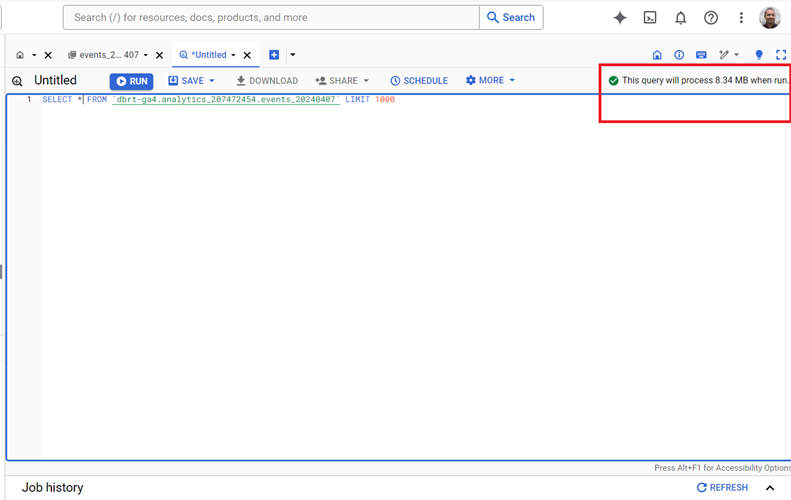
From the screenshot above, we can conclude that our query will process 8.34 MB of data when you run it.
It is always a best practice to keep an eye on how much data your query will process before you run your query.
If your query is going to process only kilobytes or megabytes of data, then you don’t need to worry.
However, if your query processes gigabytes or terabytes of data, it could be costly.
If that’s the case, query only that data, which is absolutely necessary.
Note: Your query cost depends on the number and/or size of the returned columns, not the rows. Returning 10 rows/records is going to cost you the same as returning 100k records of data. Your query cost is affected by the number of columns your query returns.
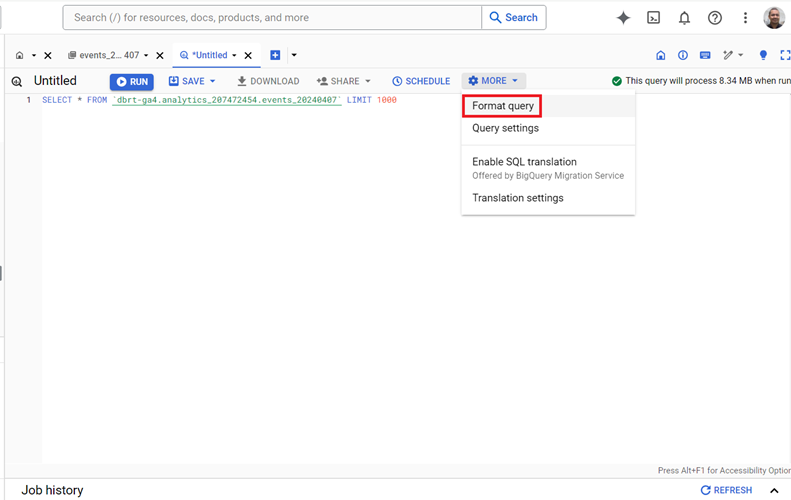
Click on the ‘Format Query’ button from the ‘More’ drop-down menu to improve the readability of our query:
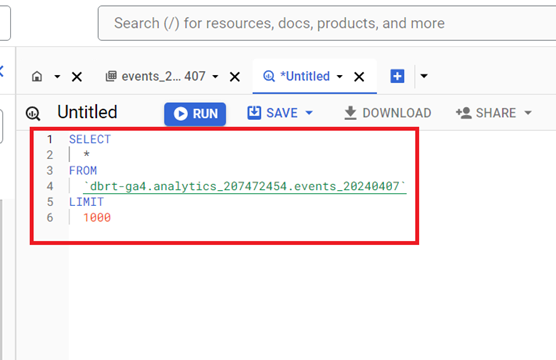
You should now see the formatted query, which is much easier to read:
Click on the ‘Run’ button to execute your query:
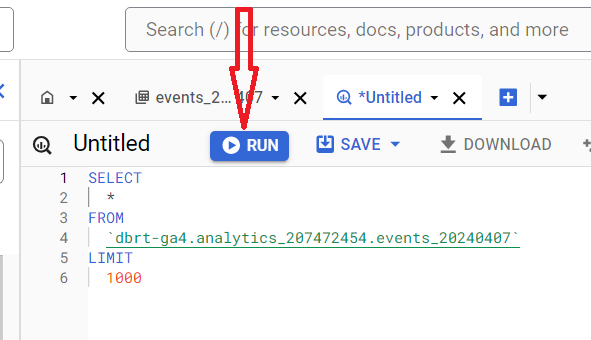
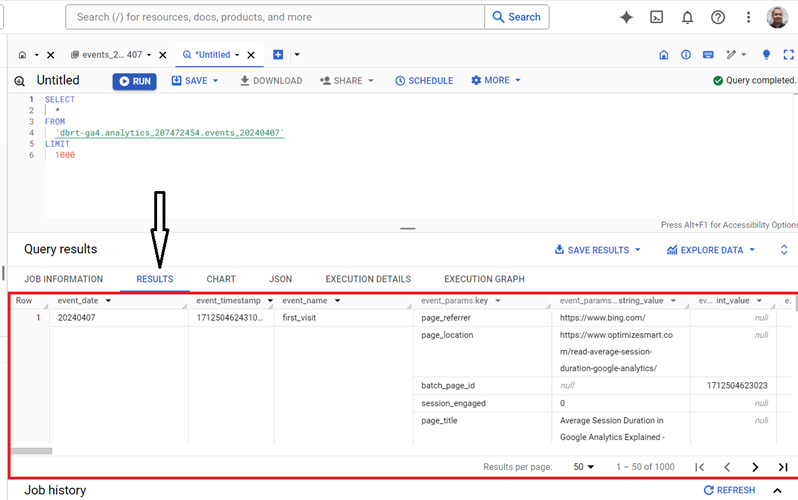
You should now see the query results in the window below:
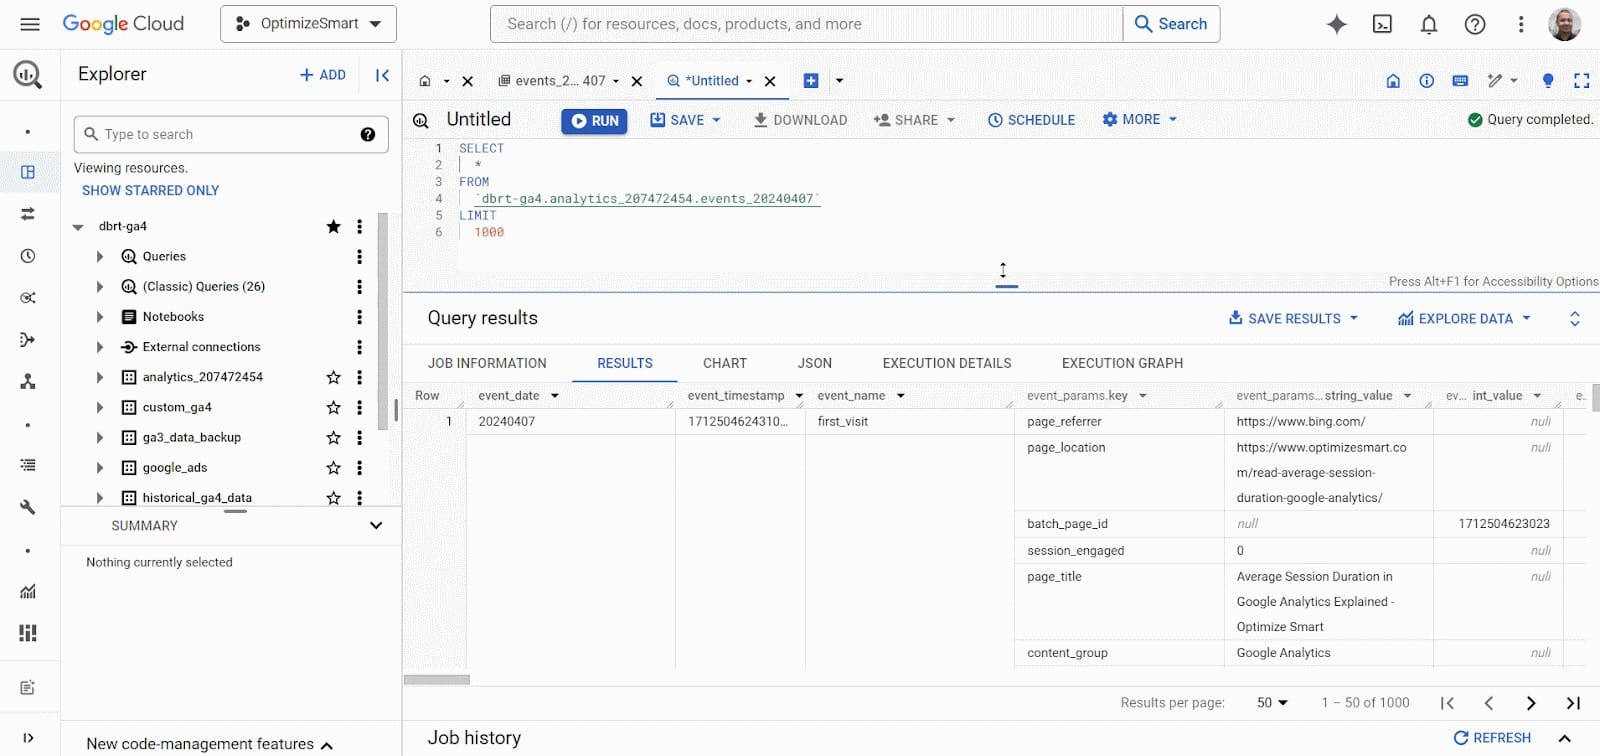
You can expand the query results window by dragging it upwards:
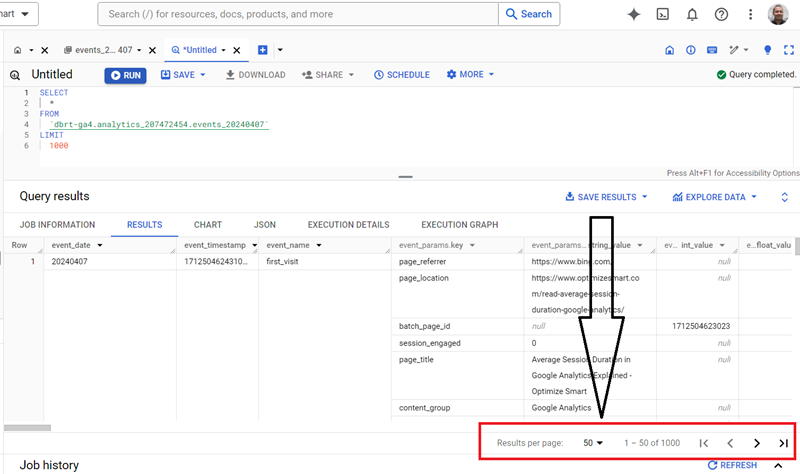
There is a navigation bar at the bottom right-hand side of your query results data table to see more records/rows:
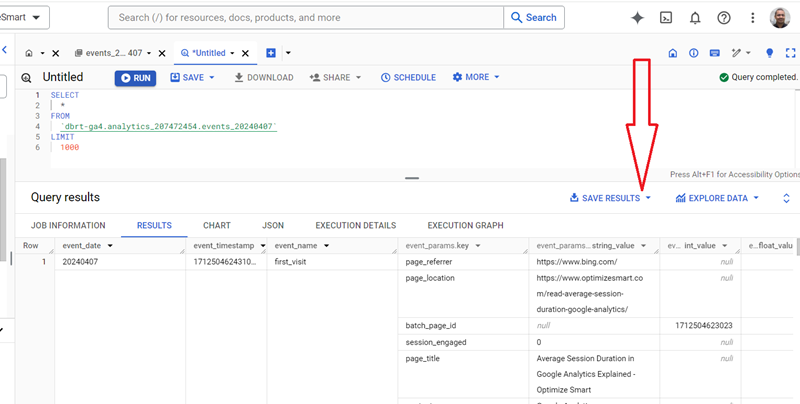
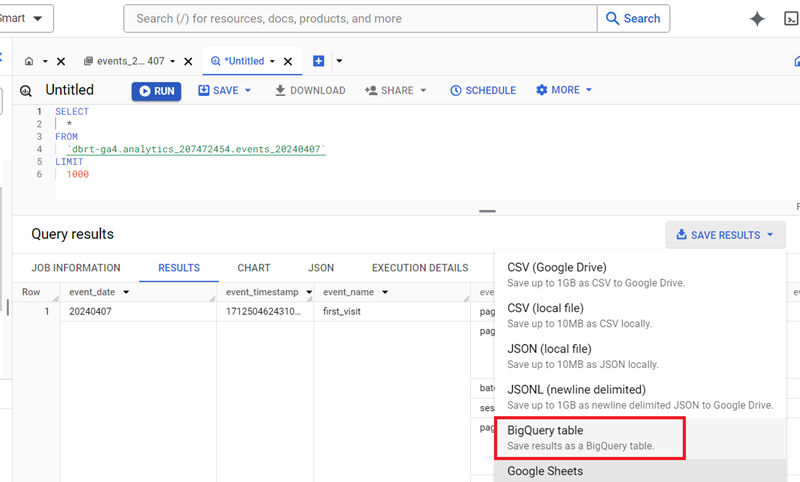
Click on the ‘SAVE RESULTS’ button to download your Query Results:
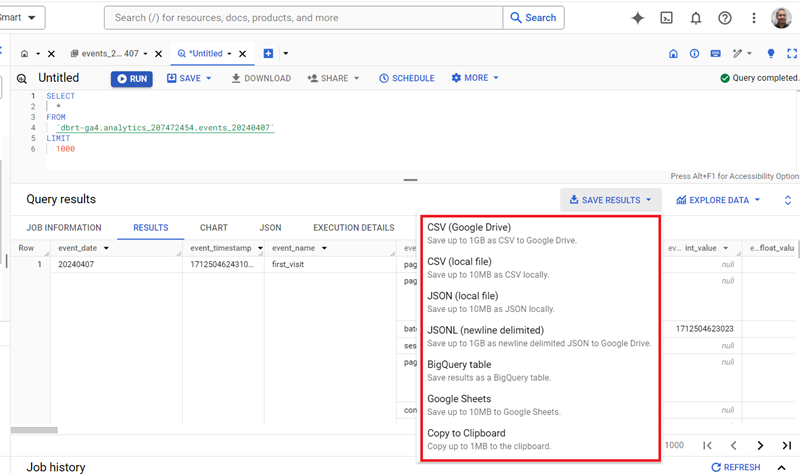
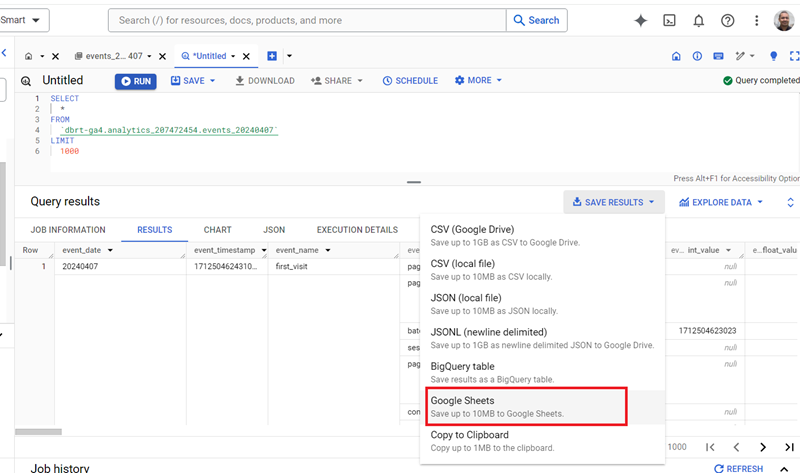
As you can see, you can download your query results into CSV, JSON, BigQuery table or Google Sheets documents.
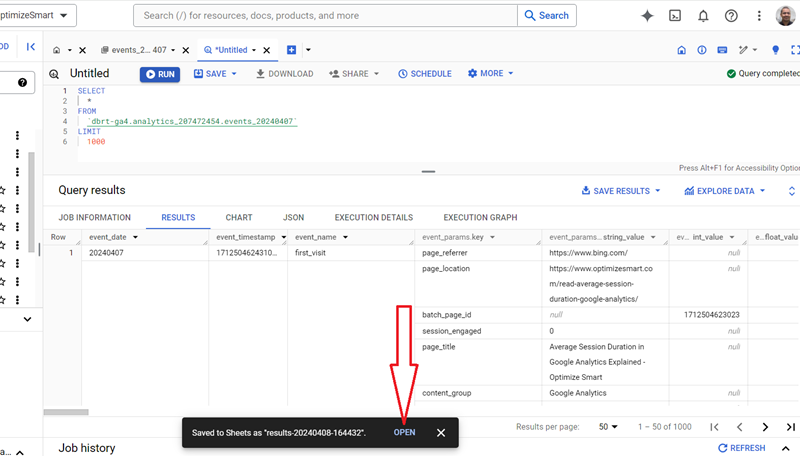
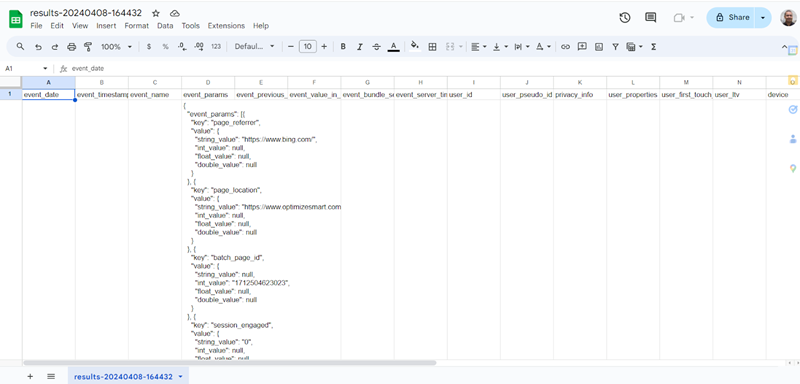
Here is what the downloaded ‘query results’ data looks like in Google Sheets:
To save your query results as a data table, click on ‘BigQuery Table’:
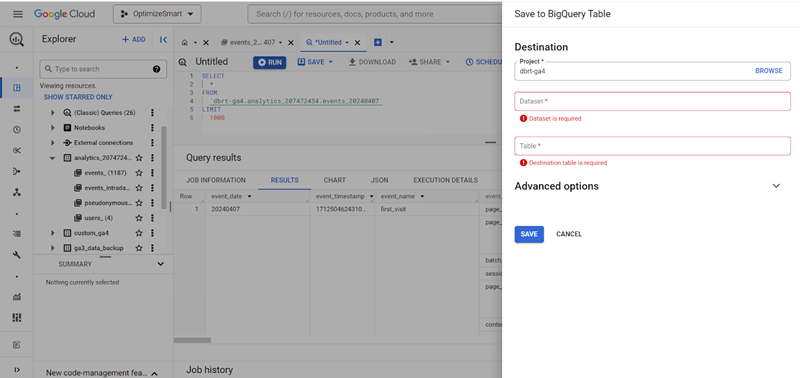
You should now see a screen like the one below:
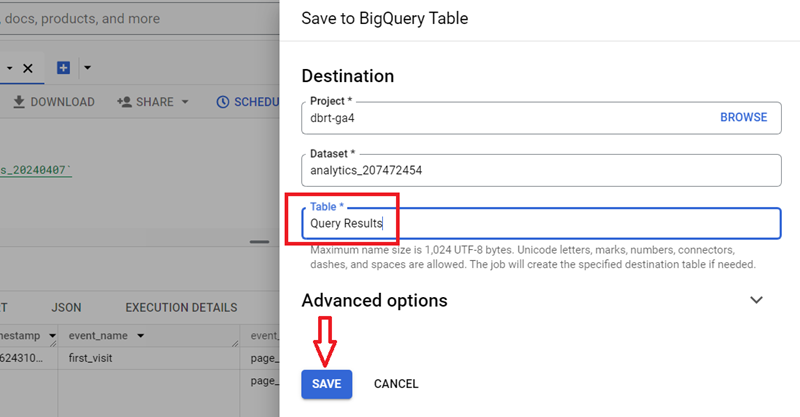
Select your dataset (from the drop-down menu), enter a table name and then click on the ‘SAVE’ button:
You should now see the new data table instead under your dataset:
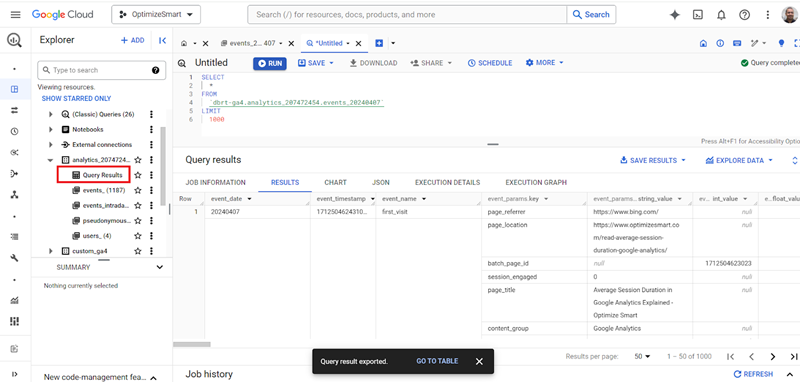
The following are the key advantages of saving query results as a data table:
#1 By saving query results as a data table, you can reuse the data multiple times without re-running the original query. It is especially beneficial for computationally expensive queries, especially if you anticipate reusing the data multiple times.
#2 When you save query results as a table, subsequent queries referencing the table can benefit from improved performance.
#3 When query results are saved as a table, you can schedule periodic updates or perform incremental updates to keep the data up to date.
#4 Saved query results can be easily shared and collaborated upon with other users in your organization or project.
#5 Saved query results can be used as a basis for generating reports in Google BigQuery. When you save query results as a table, you can utilize the stored data to create reports with various visualization and reporting tools.
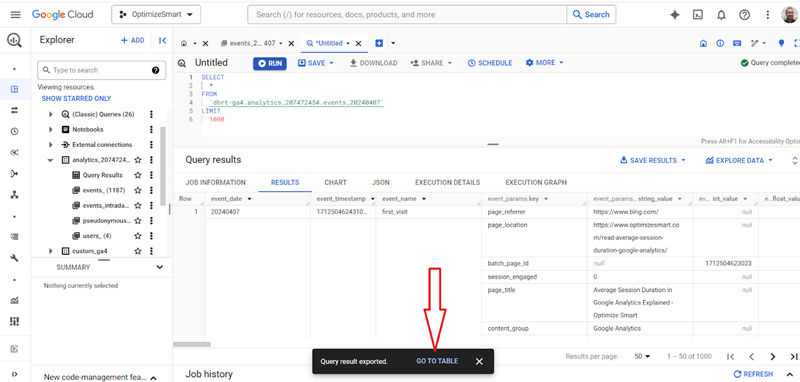
Click on the ‘GO TO TABLE’ button if you want to see your saved query as a data table:
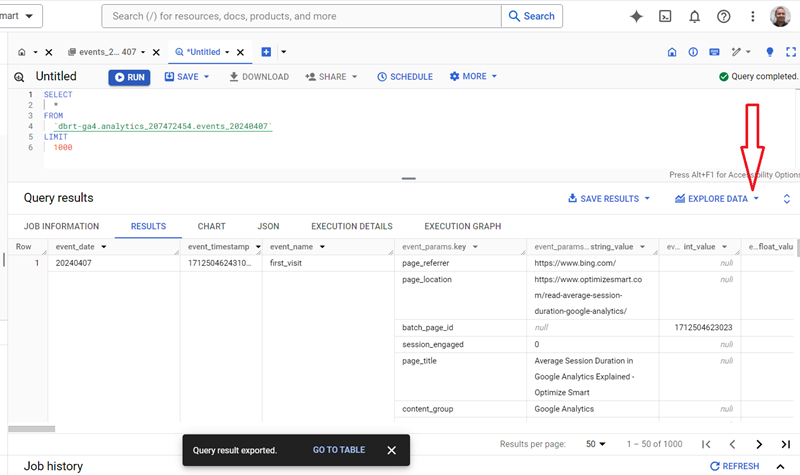
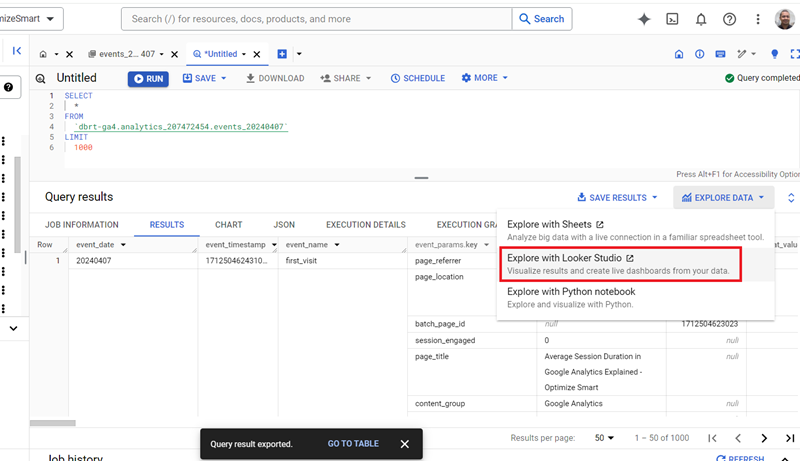
Click on the ‘EXPLORE DATA’ button to analyze query results with a live connection to Google Sheets, Looker Studio or Colab Notebook:
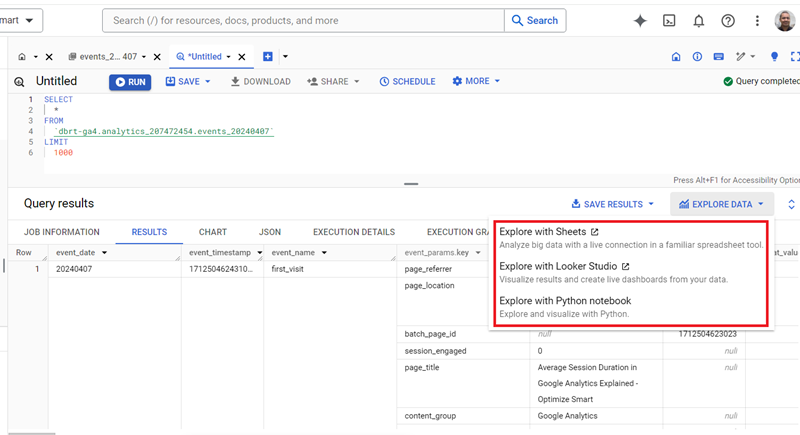
Click on the ‘Explore with Looker Studio’ option to export query results to Looker Studio:
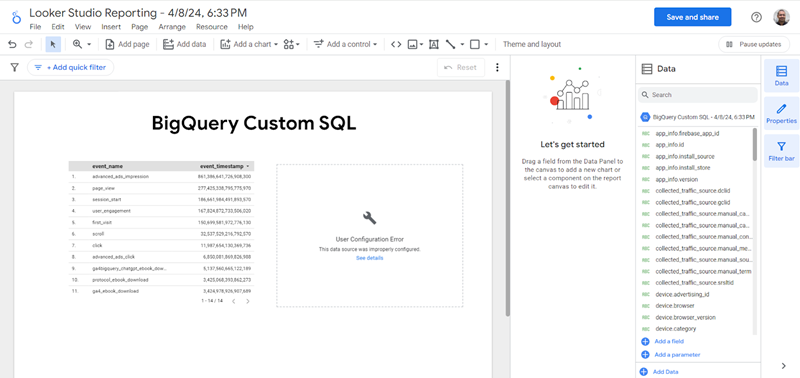
Following is an example of exported BigQuery data in Looker Studio:
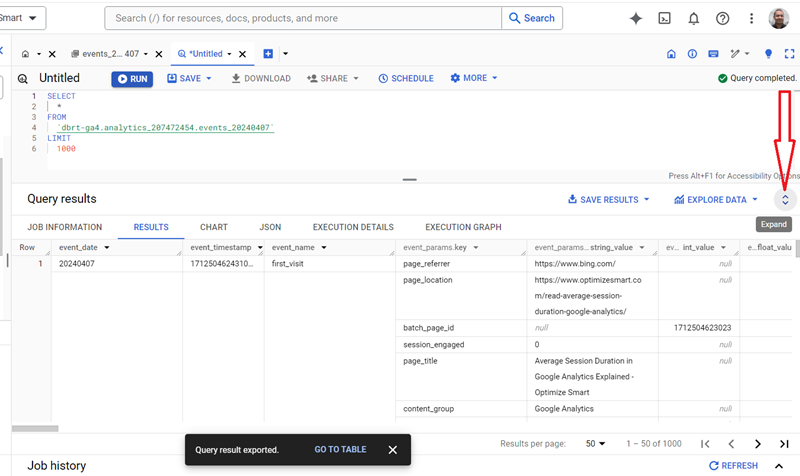
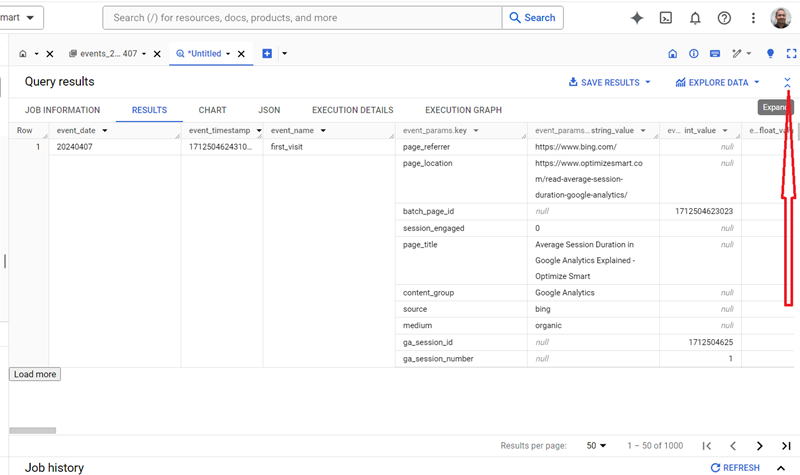
Click on the up arrow button to expand the query result window.
Here is what the expanded query result window looks like:
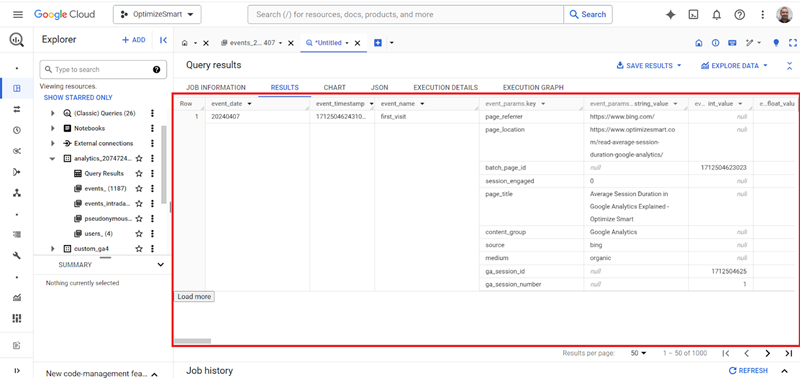
Click on the down arrow button to shrink the query result window.
Click on the ‘Refresh’ button to update the displayed query results:
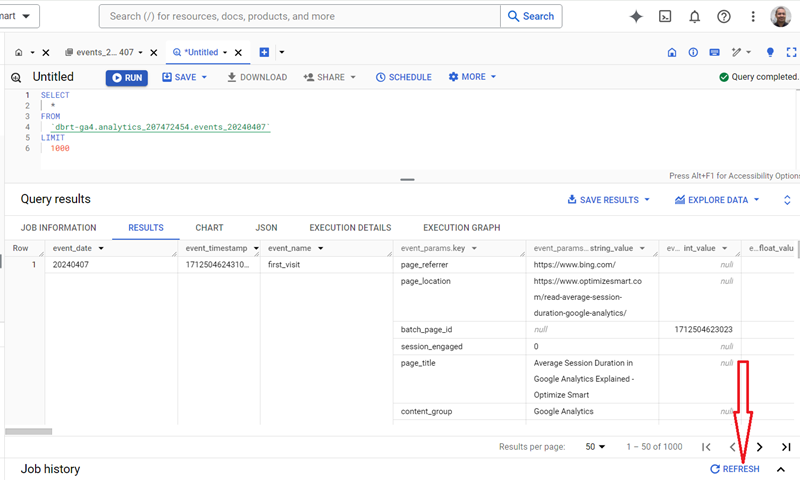
The refresh button allows you to update the displayed query results to reflect any changes in the underlying data.
By clicking the refresh button, BigQuery re-executes the query and fetches the most up-to-date data from the underlying data tables or views.
This feature is particularly useful when working with dynamic or frequently changing data. It ensures that you are viewing the most recent results.
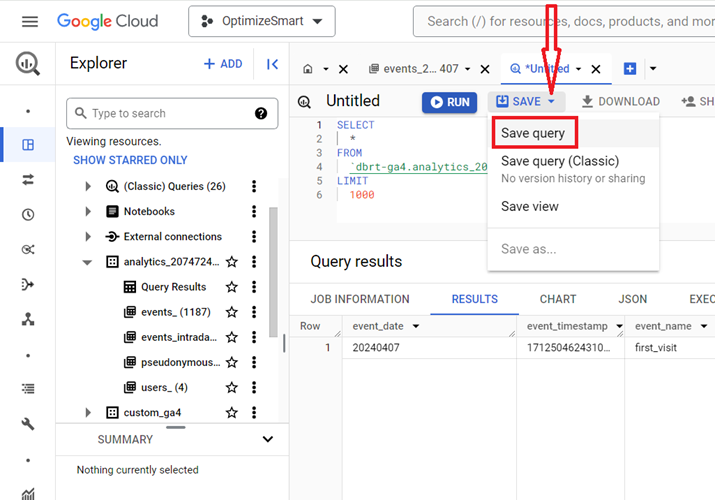
To save your SQL query, click on the ‘Save query’ option from the ‘SAVE’ drop-down menu:
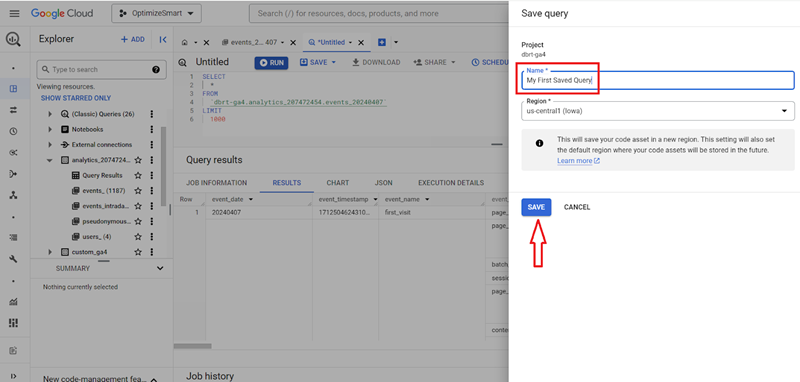
Give your query a name (like ‘My First Saved Query’ and then click on the ‘SAVE’ button:
You should now see your query listed under ‘Queries’:
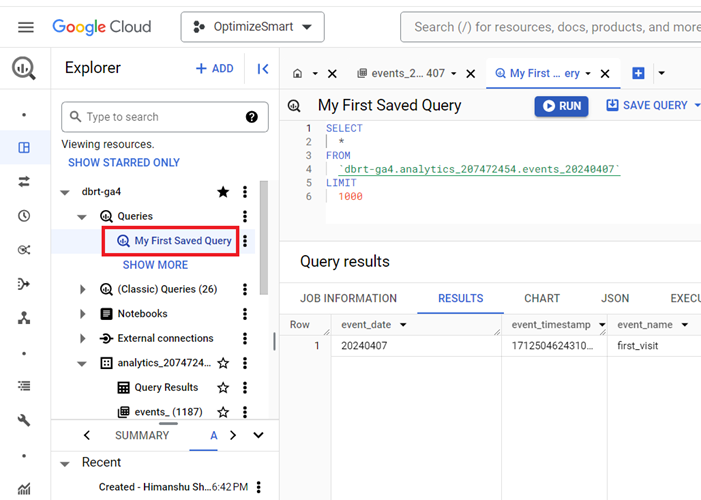
When you save a query, you can easily reuse it in the future without having to rewrite or reconstruct it. It saves time and effort, especially for complex or frequently used queries.
You can simply retrieve and execute the saved query whenever needed, promoting efficiency in your data analysis workflows.
To schedule your query, click on the ‘SCHEDULE’ button:
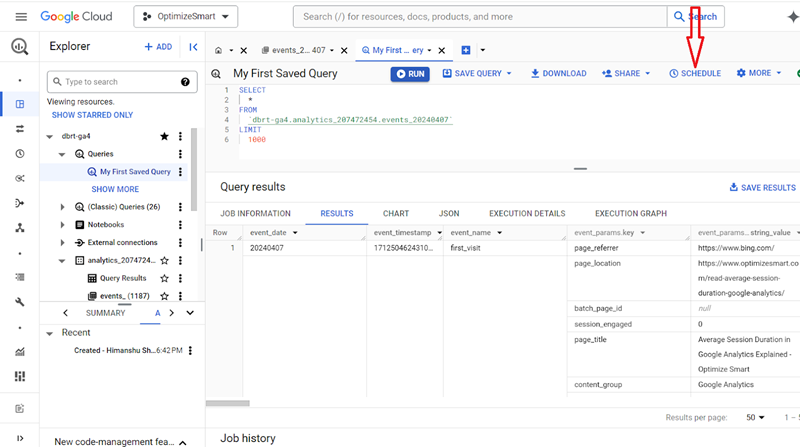
Enter the name for your scheduled query, enter schedule options, specify the destination data table for query results and then click on the ‘save’ button:
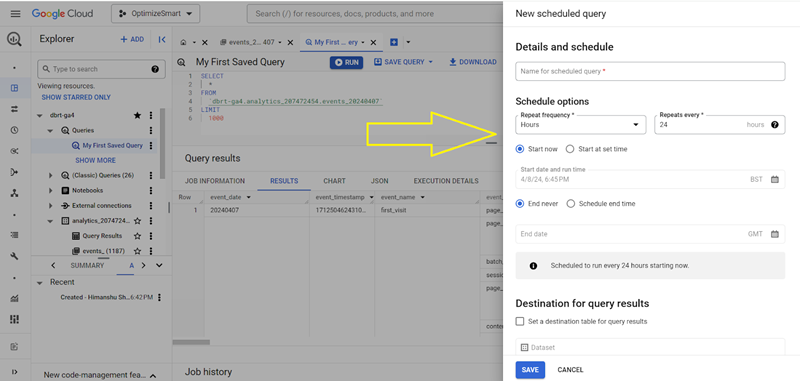
Scheduling a query allows you to ensure that your data is regularly updated by automating the execution of the query at specified intervals (such as hourly, daily, weekly, monthly etc.)
Scheduling a query eliminates the need for manual execution and saves time and effort. It is particularly useful when working with dynamic or frequently changing data.
If you want to compose a new query in a new query editor, then click on the + button:
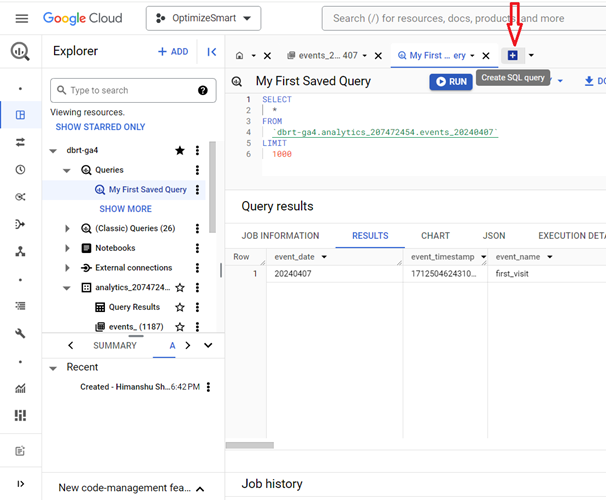
You should now see a screen like the one below:
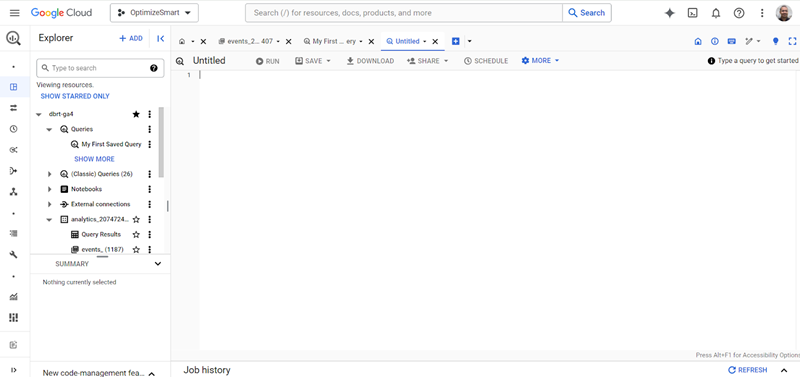
You can now enter a new query and then click on the ‘RUN’ button.
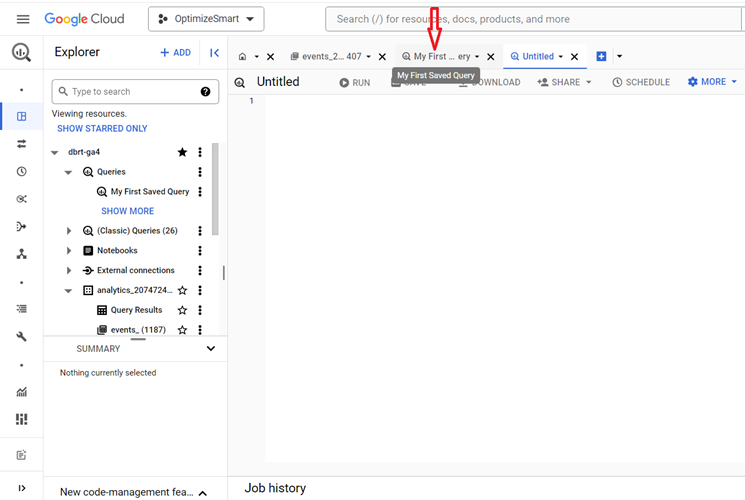
If you want to switch back to the SQL query you saved earlier, then click on the tab corresponding to the saved query:
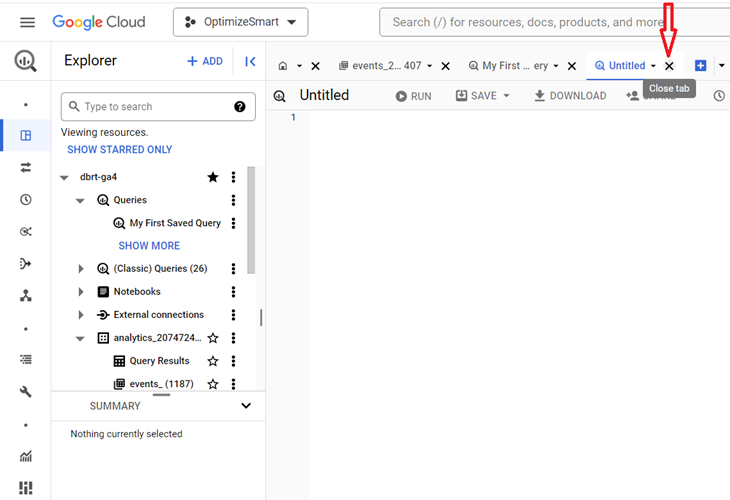
If you want to close a tab, then click on the X button:
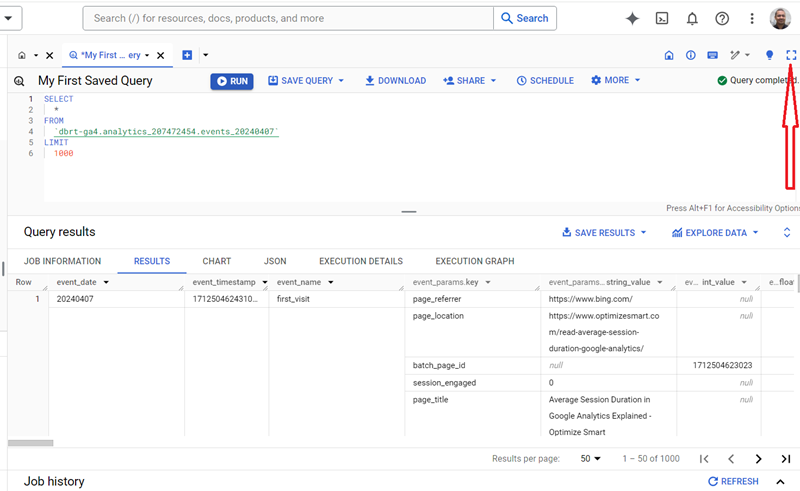
Click on the full screen button to make SQL query editor cover your whole screen:
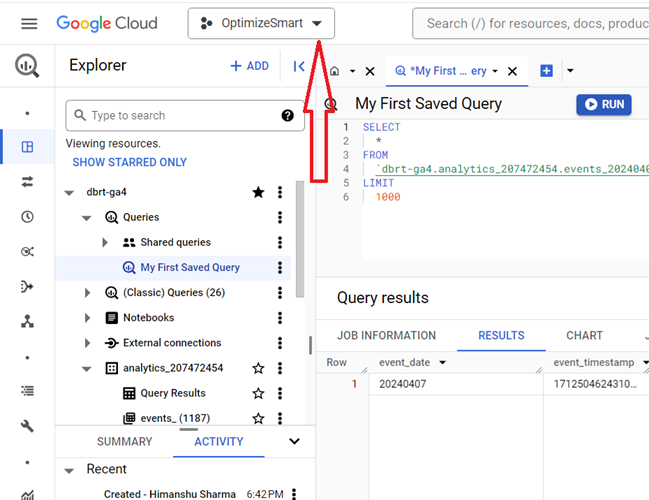
If you want to switch to a different project, then click on the ‘Project’ drop-down menu:
You should now see a screen like the one below:
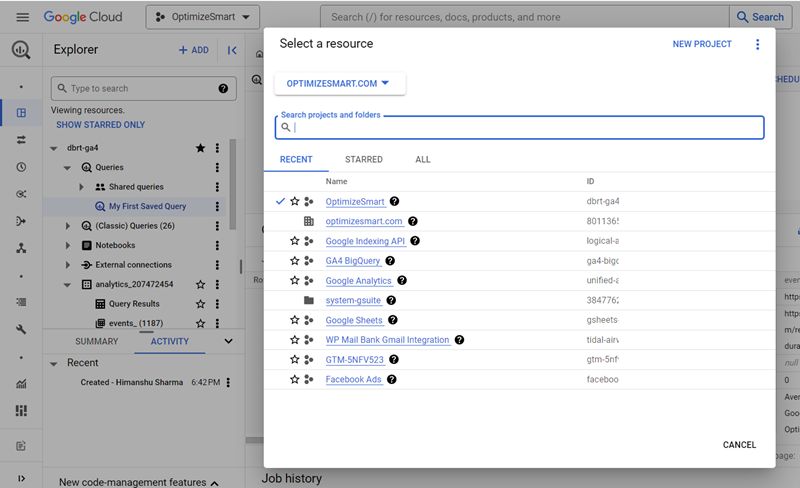
Click on the project name you want to navigate to.
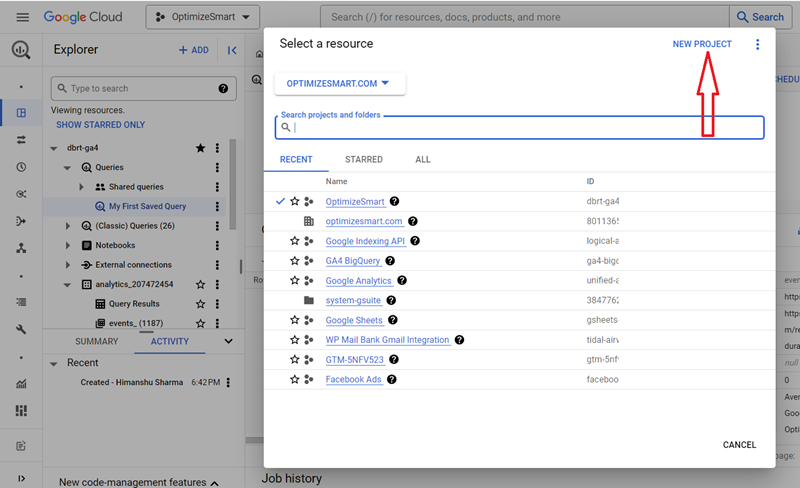
If you want to create a new project, then click on the ‘NEW PROJECT’ button:
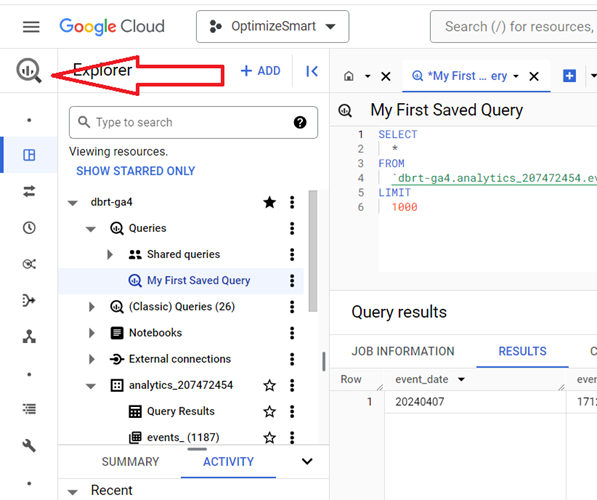
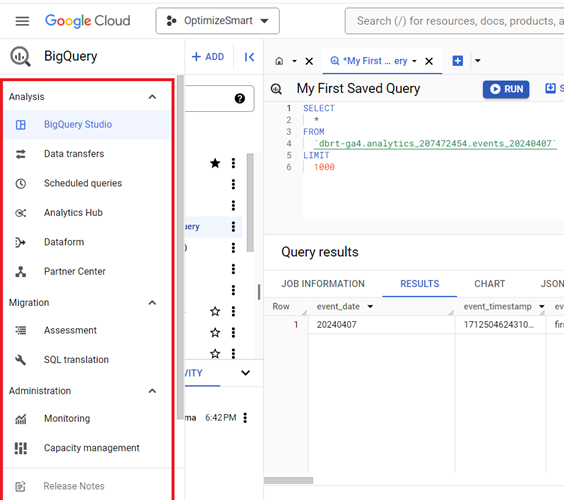
Hover your mouse over the magnifying glass on the top left-hand side of your screen to access the BigQuery menu:
Related Articles:
- GA4 to BigQuery Mapping Tutorial.
- Understanding the BigQuery User Interface.
- GA4 BigQuery Query Optimization.
- How to access a nested field in GA4 BigQuery data table.
- How to Calculate Unique Users in GA4 BigQuery.
- GA4 BigQuery Export Schema Tutorial.
- Calculating First Time Users in GA4 BigQuery.
- Extracting Geolocations in GA4 BigQuery.
- GA4 BigQuery SQL Optimization Consultant.
- Tracking Pages With No Traffic in GA4 BigQuery.
- First User Primary Channel Group in GA4 BigQuery
- How to handle empty fields in GA4 BigQuery.
- Extracting GA4 User Properties in BigQuery.
- Calculating New vs Returning GA4 Users in BigQuery.
- How to access BigQuery Public Data Sets.
- How to access GA4 Sample Data in BigQuery.

