

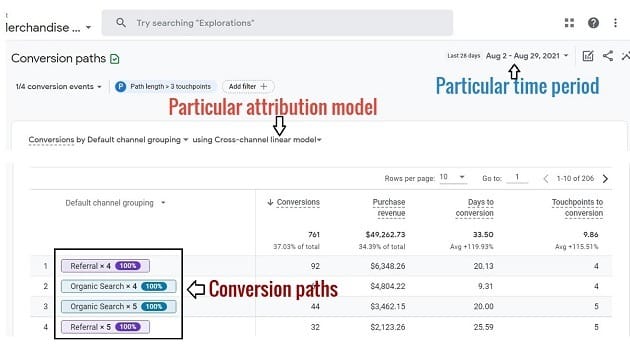
The Conversion Paths report in GA4 shows users’ paths that lead to conversions (conversion events) under a particular attribution model and in a particular time period:
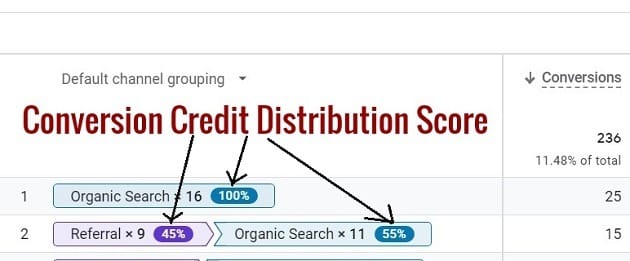
This report also shows conversion credit distribution score for each touchpoint on a conversion path:
In order to access and use the Conversion Paths report in GA4 follow the steps below:
Step-1: Navigate to your GA4 property.
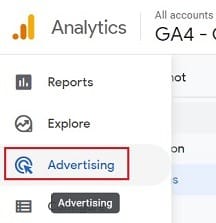
Step-2: Click on the ‘Advertising’ link from the left-hand side navigation:
You should now see the Advertising Snapshot report:
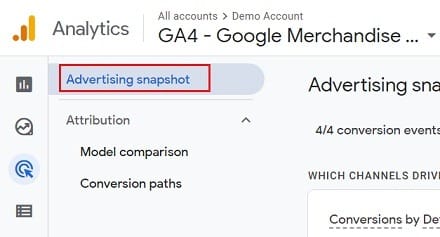
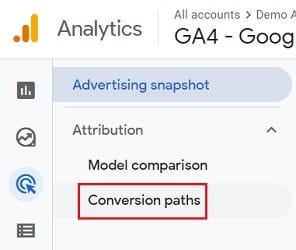
Step-3: Click on the ‘Conversion paths’ link from the left-hand side navigation:
Step-4: Select the date range from the date picker drop-down menu:
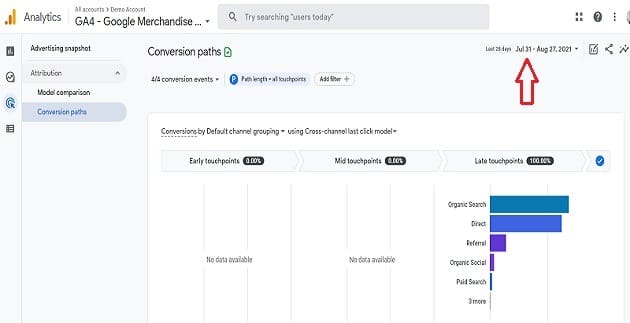
I like to select at least 30 days of historical data to make my data analysis statistically significant.
Note: The Conversion Paths report includes data from June 14, 2021, onwards.
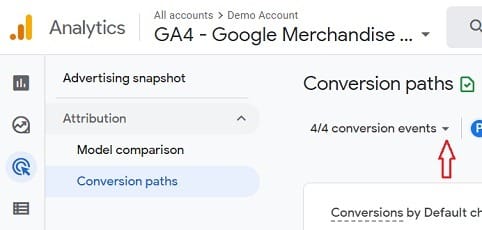
Step-5: Click on the ‘conversion events’ drop-down menu:
Step-6: Select the conversion event(s) for which you want to see the data in your Conversion Paths report while deselect all other conversion events:
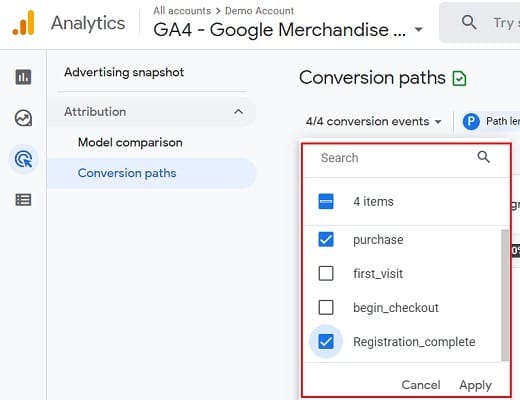
Step-7: Scroll down (if you lot of conversion events) and then click on the ‘Apply’ button.
You should now see the Conversion Paths report only for the selected conversion event(s):
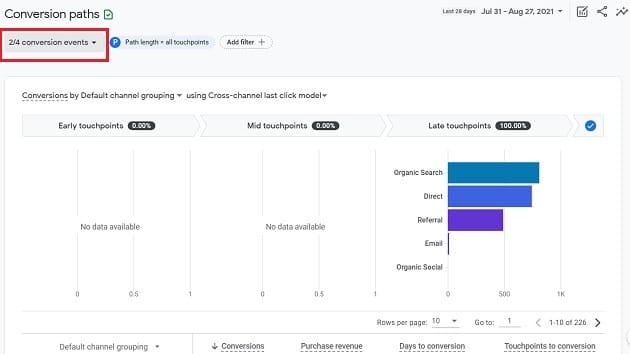
Note: By default, the Conversion paths report shows data for all your conversion events.
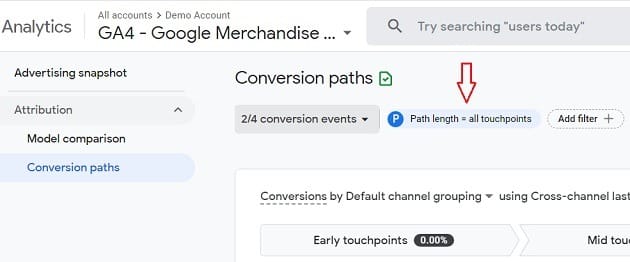
Step-8: Change the Path length of the conversion paths report (optional). To do that click on the ‘Path Length = all touchpoints’ button:
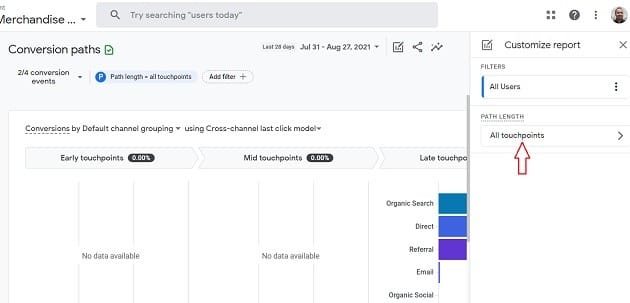
Step-9: Click on the ‘All Touchpoints’ button on the overlay on the right-hand side of your screen:
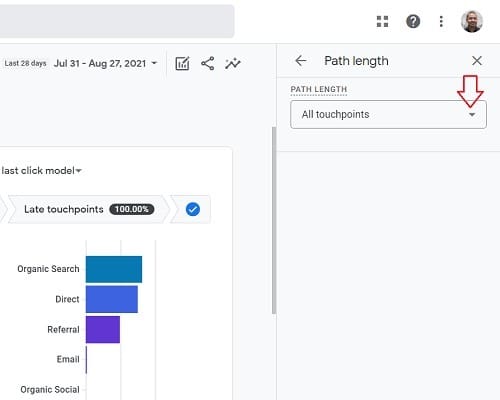
Step-10: Click on the ‘All Touchpoints’ drop-down menu:
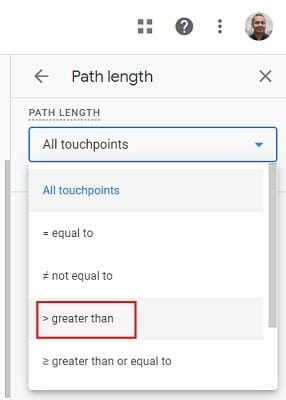
Step-11: Select an operator to filter the path lengths of the conversion paths. Let’s select ‘> greater than’:
Step-12: Enter the number of touchpoints you want to see in your conversion paths and then click on the ‘Apply’ button:
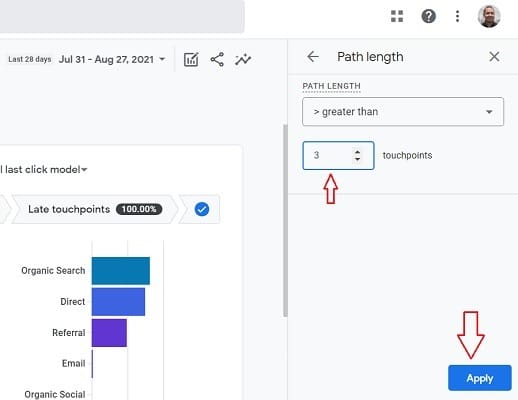
Note: By default, the Conversion Paths report display all conversion paths up to 50 touchpoints long.
Step-13: By default, the Conversion Paths report shows data for all users. If you want to see data for another audience then click on the ‘All Users’ button (optional):
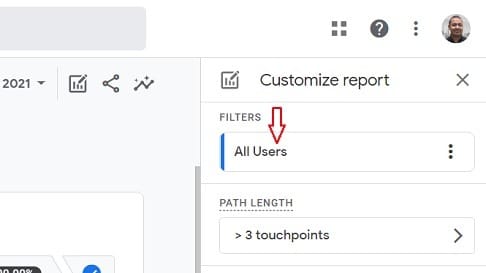
You can also click on the ‘Add filter’ button to see the conversion path data for an audience other than the ‘All Users’:
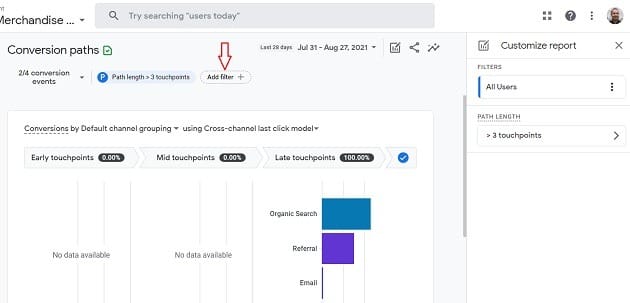
Note: The ‘Add filter’ feature works just like the GA4 Comparisons feature.
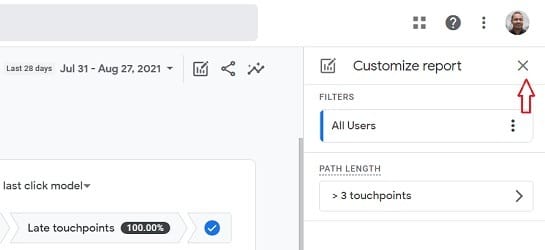
Step-14: Click on the cross button next to ‘Customize report’ to close the overlay:
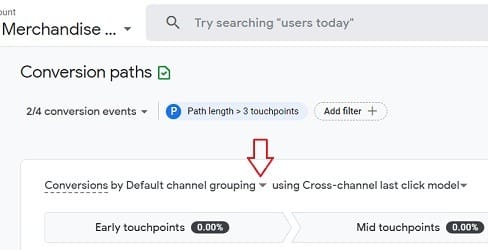
Step-15: Select the dimension you want to use for your conversion paths analysis by clicking on the dimensions drop-down menu (optional):
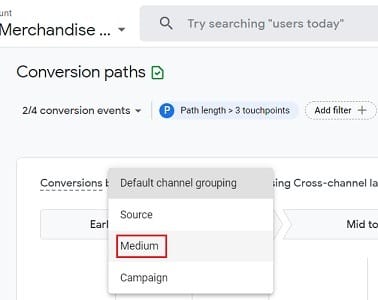
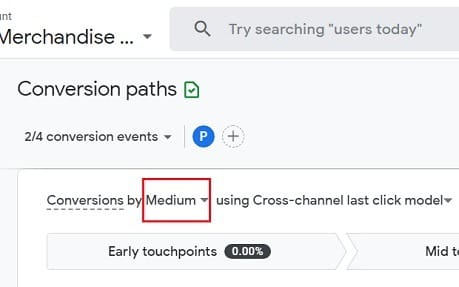
Let’s select ‘medium’ as the dimension:
Step-16: Select the attribution model you want to use for your conversion paths analysis by clicking on the attribution model drop-down menu (optional):
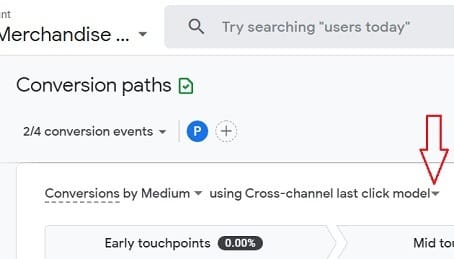
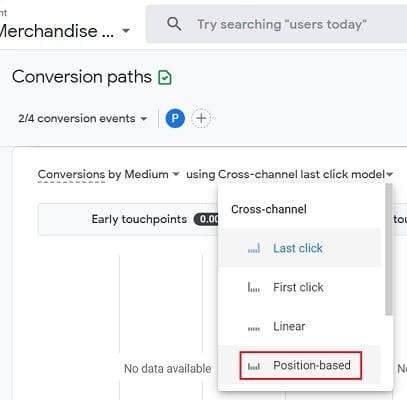
Let’s select the position-based attribution model:
You should now see a data visualization like the one below:
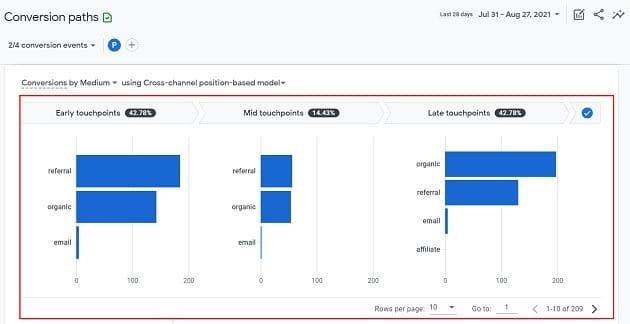
Through data visualization, you can determine the dimension (like medium) which initiated, assisted and closed conversions.
The data visualization is divided into the following three segments:
- Early touchpoints
- Mid touchpoints
- Late touchpoints
Early touchpoints
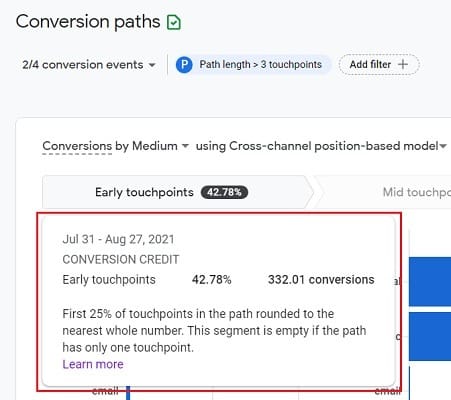
Google consider the first 25% of touchpoints on a conversion path rounded to the nearest whole number as early touchpoints.
Hover your mouse over the ‘Early touchpoints’ segment to see more details about the segment:
The bar chart that you see under the ‘Early touchpoints’ segment show how much conversion credit a particular dimension receives as early touchpoints:
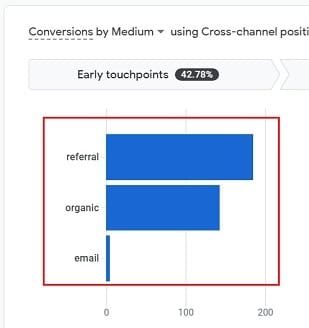
Hover your mouse over a bar (let’s say ‘referral) in the bar chart to see more details about the conversion credit distribution:
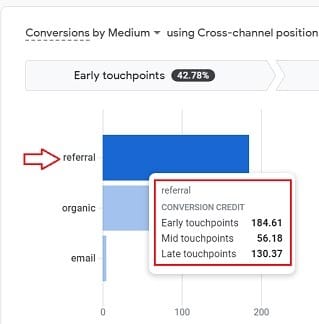
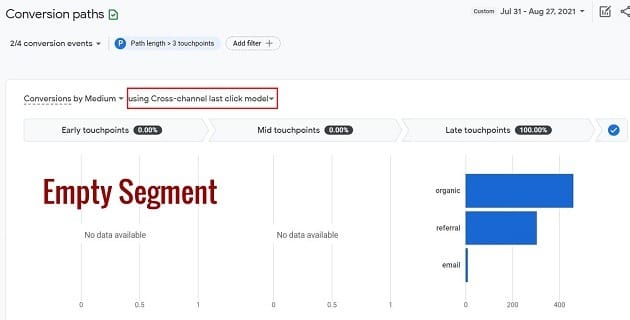
Note: If a conversion path has only one touchpoint then the ‘Early touchpoints’ segment would appear as empty. The ‘Early touchpoints’ segment would also appear empty if you select one of the following attribution models:
- Last click
- Ads-preferred last click
Mid touchpoints
Google consider the middle 50% of touchpoints on a conversion path as mid touchpoints.
Hover your mouse over the ‘Mid touchpoints’ segment to see more details about the segment:
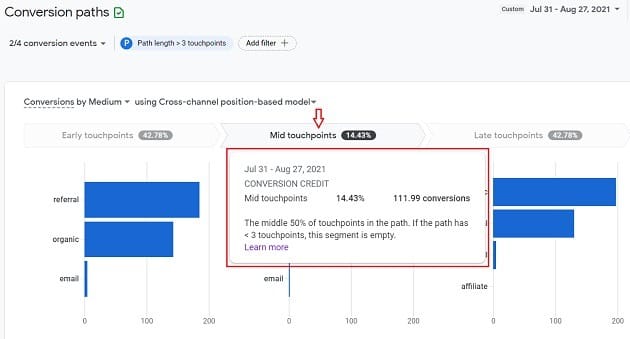
The bar chart that you see under the ‘Mid touchpoints’ segment show how much conversion credit a particular dimension receives as middle touchpoints:
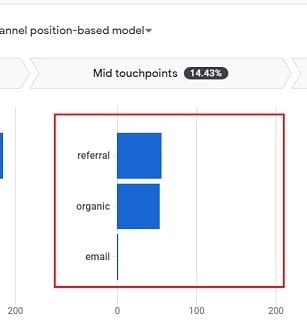
Hover your mouse over a bar (let’s say ‘referral) in the bar chart to see more details about the conversion credit distribution:
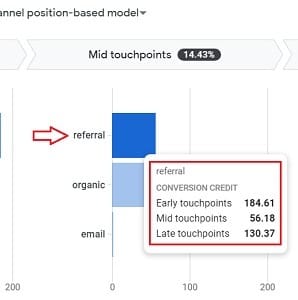
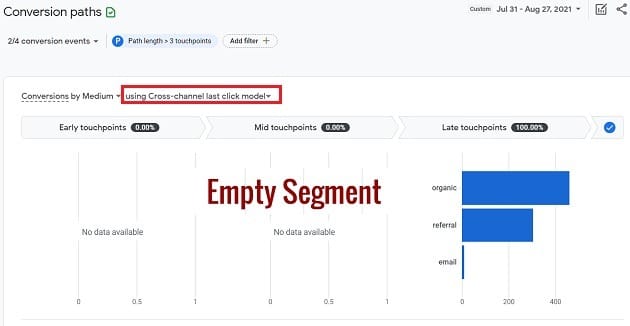
Note: If a conversion path has less than 3 touchpoints then the ‘Mid touchpoints’ segment would appear as empty. The ‘Mid touchpoints’ segment would also appear empty if you select one of the following attribution models:
- Last click
- First click
- Ads-preferred last click
Late touchpoints
Google consider the last 25% of touchpoints on a conversion path rounded to the nearest whole number as the late touchpoints.
Hover your mouse over the ‘Late touchpoints’ segment to see more details about the segment:
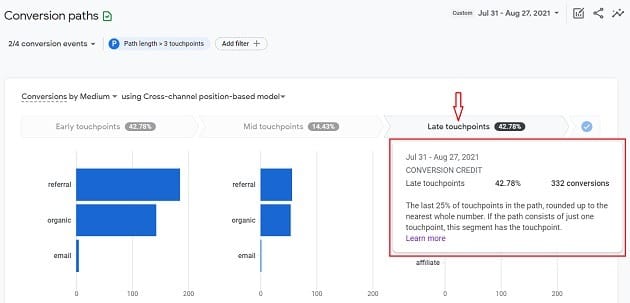
The bar chart that you see under the ‘Late touchpoints’ segment show how much conversion credit a particular dimension receives as late touchpoints:
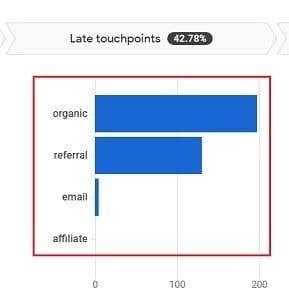
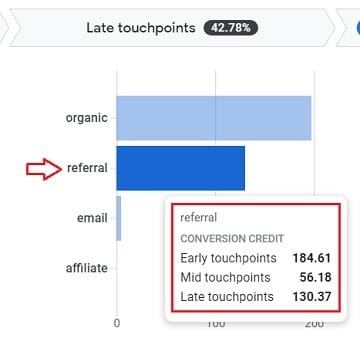
Hover your mouse over a bar (let’s say ‘referral) in the bar chart to see more details about the conversion credit distribution:
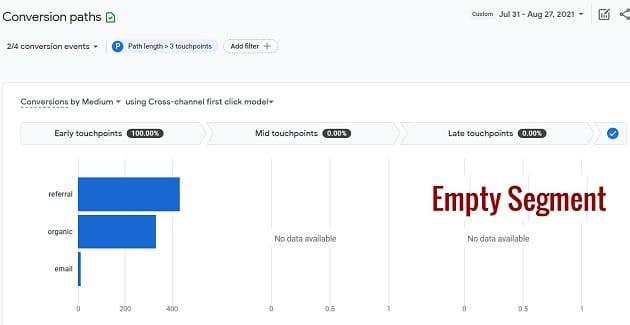
Note: If a conversion path has only one touchpoint then the ‘Late touchpoints’ segment gets all the credit for a conversion. The ‘Late touchpoints’ segment would appear empty if you select the ‘First click’ attribution model:
Step-17: Scroll down to the data table which appears below the data visualization:
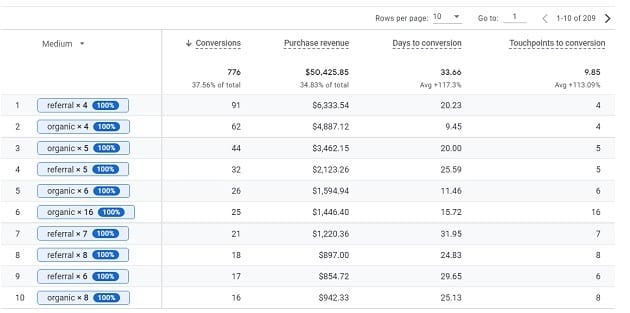
This data table is made up of one primary dimension and the following metrics:
- Conversions – The number of times your website/app users triggered a conversion event.
- Purchase revenue – The sum of revenue from purchases made on your website and/or mobile app.
- Days to conversion – The number of days it takes for users to convert.
- Touchpoints to conversion – The number of touchpoints it takes for users to convert.
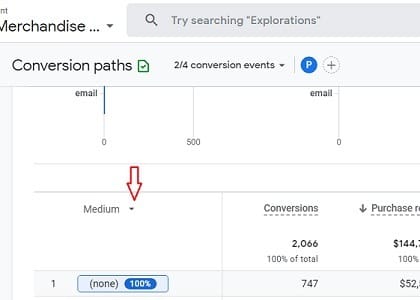
Note: If you want to change the primary dimension of the data table of the Conversion paths report then click on the Primary dimension drop-down menu:
Conversion paths report navigation features
The Conversion paths report provides the following features for easy navigation:
#1 Rows per page
By default, the data table of the Conversion paths report shows only 10 rows per page of the report.
If you want to see more than 10 rows then click on the ‘Rows per page’ drop-down menu and select the desired number of rows to be displayed:
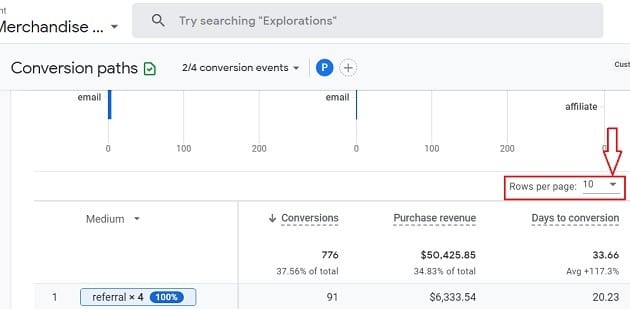
Note: You can display up to 250 rows per page of the Conversion paths report in GA4.
#2 Go to
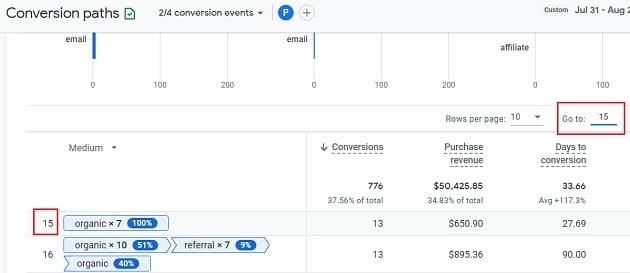
If you want to quickly navigate to a particular row of the data table of the Conversion Paths report then type the row number in the text box next to ‘Go to’ and then press the enter key:
#3 Pagination
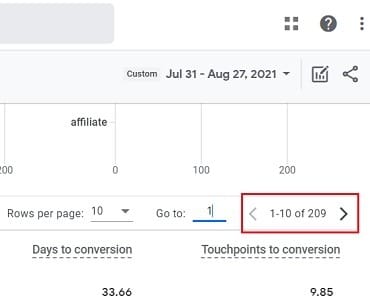
The Conversion Paths report has a pagination feature built-in through which you can navigate back and forth between various pages of the report:
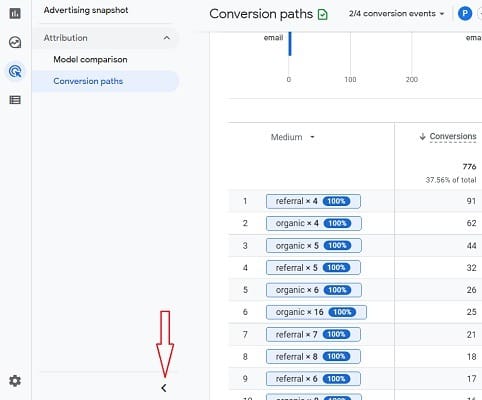
#4 Full view mode
If you want to see the conversion paths report in the full view mode then click on the ‘<’ button:
#5 Sort Columns
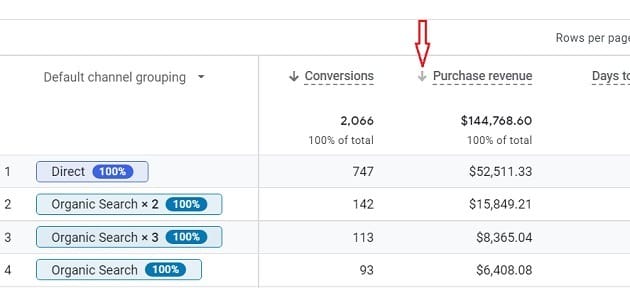
By default, the data table of the conversion paths report is sorted by conversion paths with the highest number of conversions.
Click the down arrow button next to one of the other metrics in the data table to sort the data table by that metric:
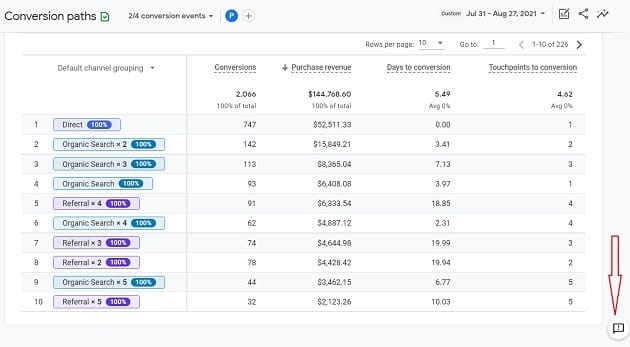
#6 Provide feedback
If you want to provide feedback about the conversion paths report to Google then click on the feedback button at the bottom right of the report:
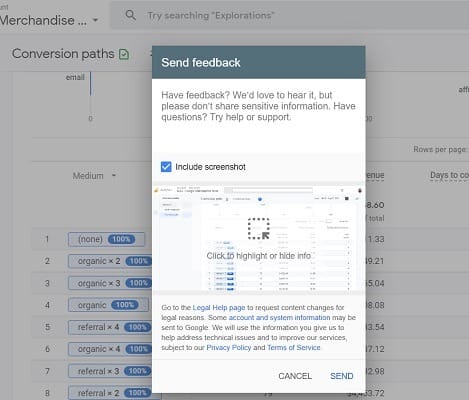
Then follow the on-screen instructions to send your feedback:

Other Articles on GA4.
- Understanding Google Tag Manager Container Tag.
- Google Analytics Debugger, GTM Debugger Tutorial.
- Tracking web pages with zero pageviews in Google Analytics 4.
- How to Connect Google Analytics 4 with BigQuery.
- 100+ Google Analytics Remarketing Audiences for Retargeting.
- Google Tag Manager Workspaces Tutorial.
- Stop Trusting GA4/GTM Tag Coverage Report – Do This Instead.
- Some of your pages are not tagged in GTM/GA4 [Fixed].
- Tracking single page apps in Google Analytics via GTM.
- Anonymize IP in Google Analytics, gtag & Google Tag Manager.
- Matomo vs Google Analytics vs Piwik Pro - Best Google Analytics Alternative.
- Are You Waiting 12 Days Before Analyzing GA4 Data?
- Using Element Visibility Trigger in Google Tag Manager (GTM).
- Google Analytics Javascript Tutorial.
- Google Tag Manager Debugger Console Tutorial.
- Data Trend Analysis in Google Analytics.
- Facebook Pixel vs Google Analytics Data Discrepancies.
- Google Analytics 4 Model comparison report.
- 10 methods to fix (not set) Landing page issues in GA4.
- How to use the Conversion Paths report in GA4.