

Methods to track zero pageviews in GA4.
There are three methods to track web pages with zero pageviews in GA4:
#1 Track web pages with less than 30 pageviews in the last month or any month.
#2 Use the ‘Tag Coverage’ report to find web pages with no recent activity (less reliable).
#3 Use Screaming Frog SEO Spider to find web pages with no pageviews (Highly Recommended).
The concept of zero traffic is time-bound.
Google Analytics 4 (GA4) does not report on web pages with zero pageviews in a selected time period.
However,
GA4 reports on web pages with zero pageviews on certain days and one or more pageviews on other days in a selected time period.
Thus, the concept of zero traffic is time-bound.
Almost every web page on your website got traffic at some point in its lifetime.
If you look at your GA4 reports over a very long time frame, you may see a pageview recorded for almost every page on your website.
The web pages with zero pageviews do not add value to your business’s bottomline. They do not generate any traffic.
By identifying such web pages, you can either update them to increase their search engine ranking position or repurpose their content.
Overview of tracking web pages with less than 30 pageviews.
If a web page has fewer than 30 pageviews in the last month or any month, it means it got zero pageviews on one or more days of the month.
This is the easiest way to determine zero-traffic pages on your website.
There is no website crawl, no Excel hacks, and everyone can do it pretty easily with just a few clicks.
GA4 uses the ‘Views‘ metric to report on pageviews.
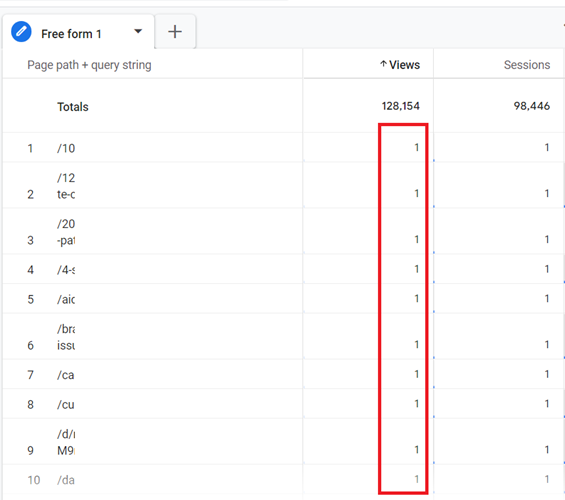
The following is the 10,000-foot view of tracking web pages with zero pageviews by tracking web pages with less than 30 pageviews in a month.
- Change the reporting identity of your GA4 property to device-based so that you can view web pages with low page views.
- Create a new exploration report using the ‘Blank’ exploration report template.
- Create a list of query parameters that are being used on your website but which do not change the contents of a web page.
- Use the dimension filters to exclude the identified query parameters in the exploration report. This is required to make your report more readable.
#1 Change the reporting Identity to ‘Device-based’.
By changing the reporting identity of your GA4 property to ‘device-based’, you can see the traffic of web pages with low pageviews that might otherwise be obscured due to data thresholding issues.
Follow the steps below to change the reporting identity of your GA4 property to ‘Device-based’:
Step-1: Navigate to the Admin area of your GA4 property.
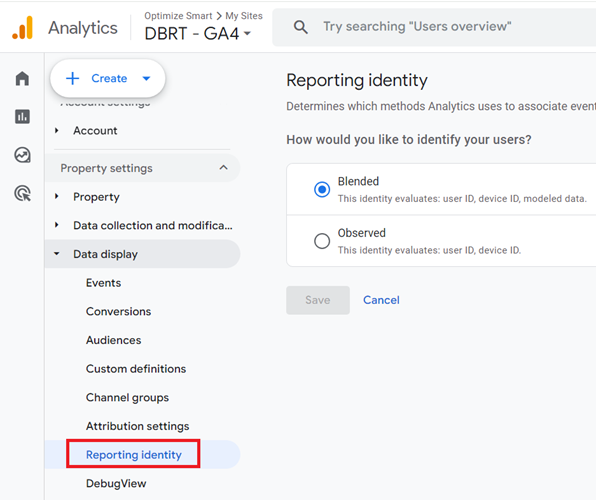
Step-2: Click on the ‘Reporting Identity‘ link under ‘Data Display’:
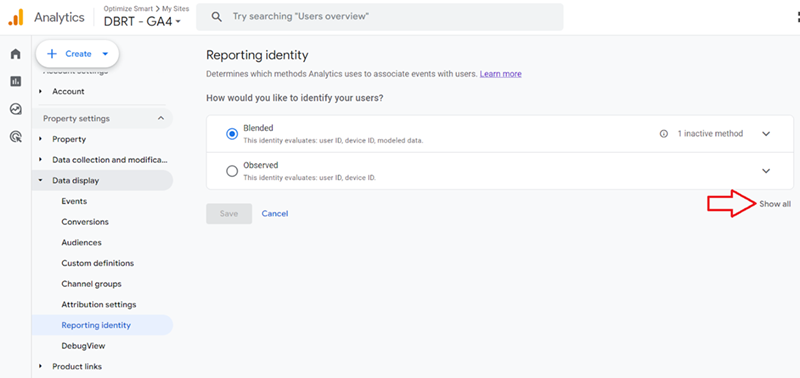
Step-3: Click on the ‘Show All‘ link:
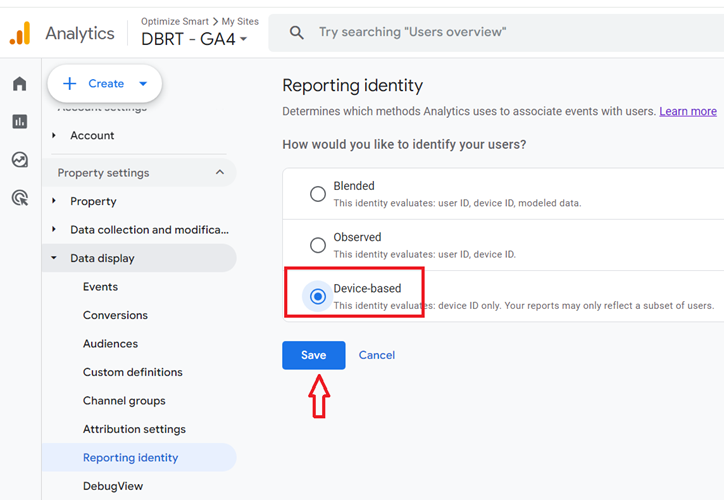
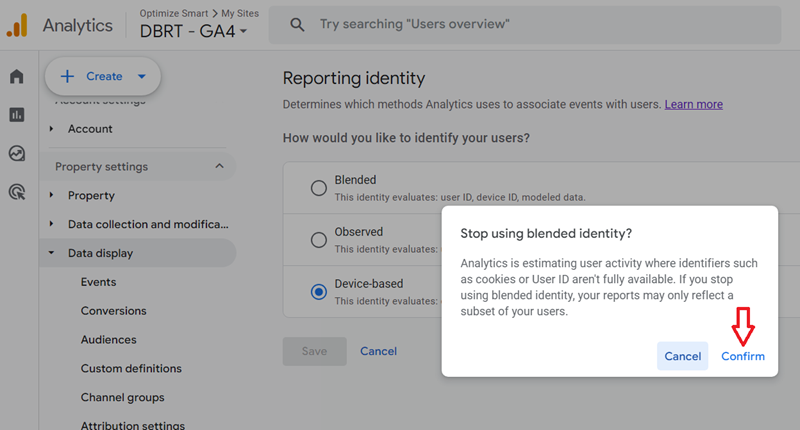
Step-4: Click on ‘Device-based‘ and then click on the ‘Save‘ button:
Step-5: Click on the ‘Confirm’ button:
#2 Create a new exploration report.
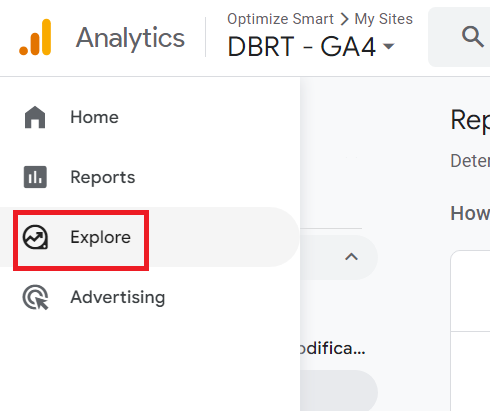
Step-1: Click on Explore from the left-hand side menu:
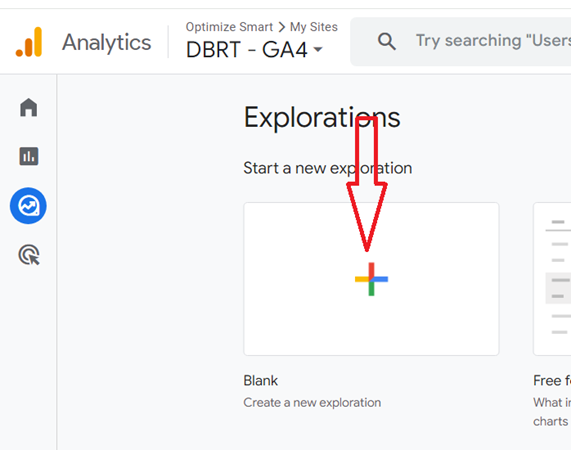
Step-2: Click on the ‘Blank’ exploration report template:
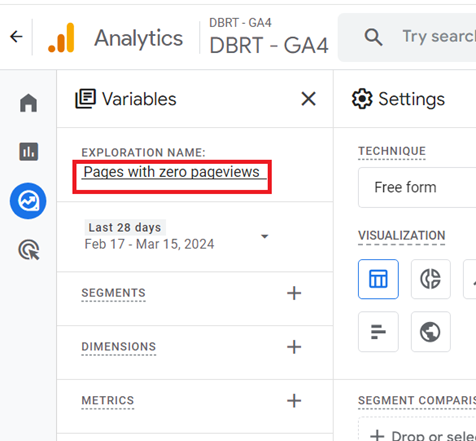
Step-3: Name your report ‘Pages with zero pageviews’:
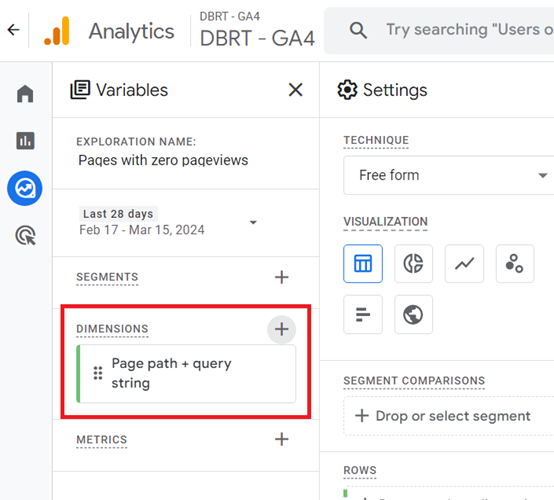
Step-4: Click on the + button next to ‘DIMENSIONS’ and import the ‘Page path + query string’ dimension to the report.
You should now see the imported dimension listed under the ‘DIMENSIONS’ section:
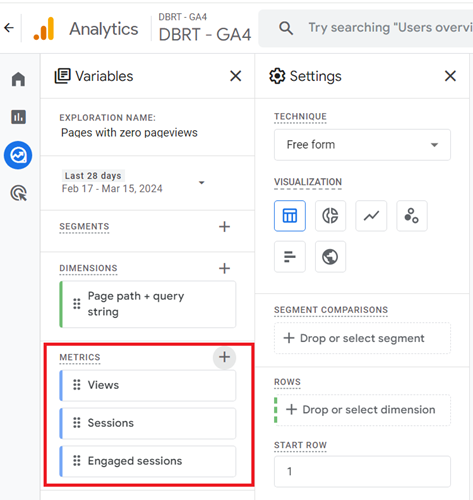
Step-5: Click on the + button next to ‘METRICS’ and import the following metrics to the report:
- Views
- Sessions
- Engaged Sessions
You should now see all the imported metrics listed under the ‘METRICS’ section:
Step-6: Double click on the dimension ‘Page Path + query string’ so that it is automatically added to the Rows section:
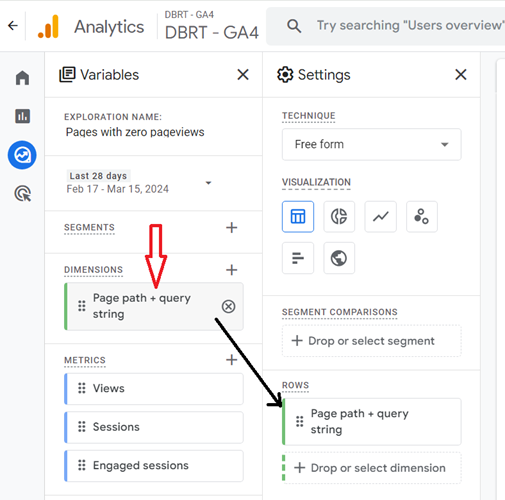
Note: When you double-click on the ‘‘Page Path + query string’ dimension, you won’t see any change to the canvas on the right. But the dimension has been added to the canvas. When you start adding metrics to the canvas, you will see the dimension(s) added to the canvas.
Step-7: Double click on the following metrics one by one, starting from the very top, so that they are automatically added to the blank canvas on the right:
- Views
- Sessions
- Engaged Sessions
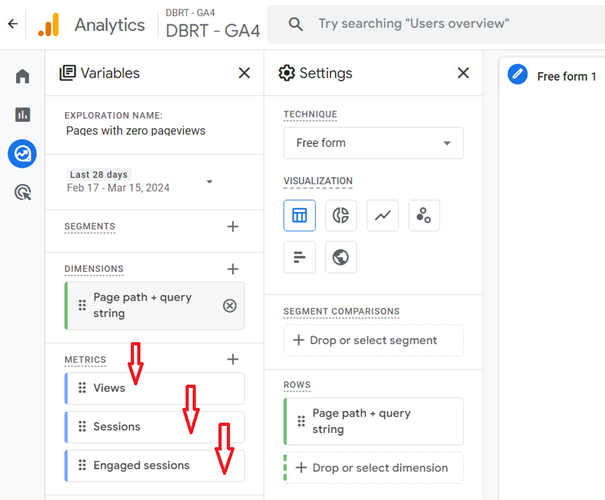
You should now be able to see the dimensions and metrics added to the report canvas on the right:
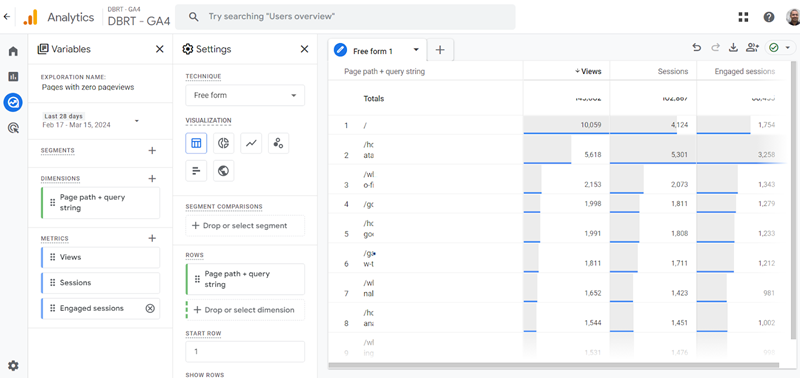
#3 Exclude unwanted query parameters from your exploration report.
In your expiration report, you are likely to see the same URLs reported multiple times, which happens because the URLs contain query parameters.
To clean up the report, we would need to exclude query parameters.
Step-1: Create a list of query parameters that are being used on your website but which do not change the contents of a web page. Your web developer can help you with this task.
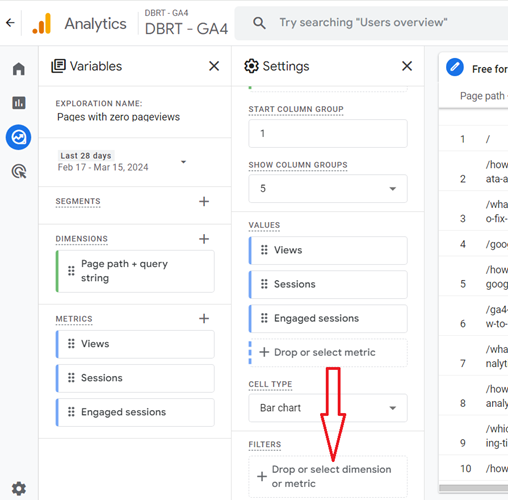
Step-2: Scroll down to the ‘FILTERS‘ section under ‘Settings‘ and then click on the button ‘Drop or select dimension or metric‘:
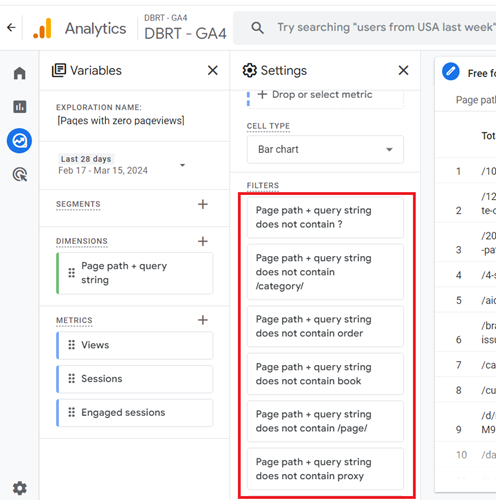
Step-3: Start adding filters one by one that help you exclude your query parameters from your report:
Step-4: Sort the ‘Views’ column on the canvas in descending order by clicking on the ‘Views’ column header.
Now you should be able to see the list of all the web pages which got zero pageviews on certain days in the last month:
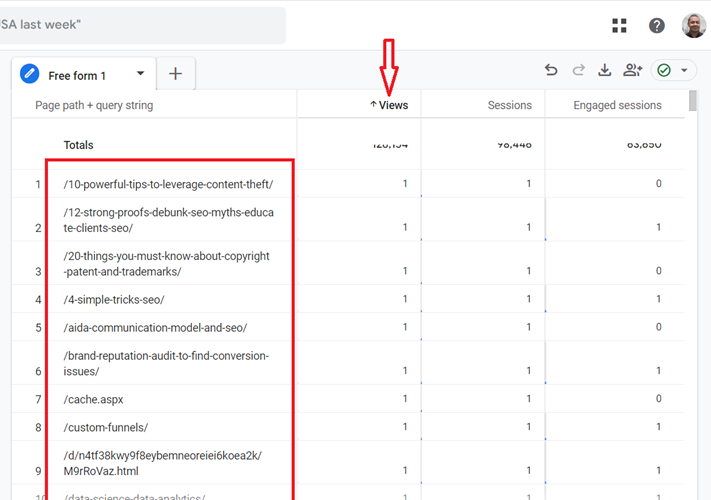
Step-5: Download the report (click on the ‘Export Data‘ button) and then update the articles or repurpose them.
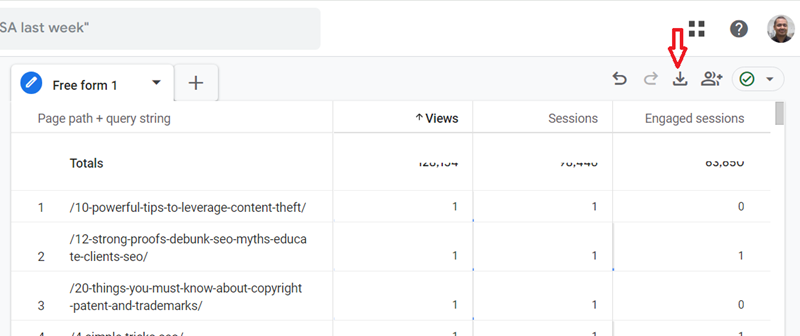
Note: You would need to append the domain name to the URIs in either Excel or Google Sheets.
Using the ‘Tag Coverage’ report to track web pages with zero pageviews in GA4 (less reliable).
Step-1: Navigate to the Admin section of your GA4 property.
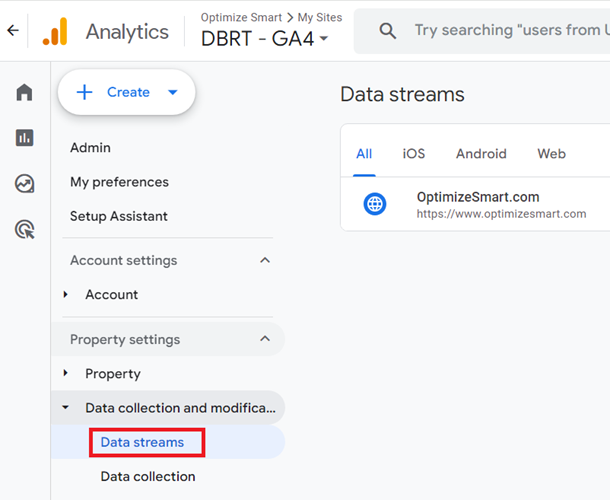
Step-2: Navigate to ‘Data collection and modification‘ > Data streams.
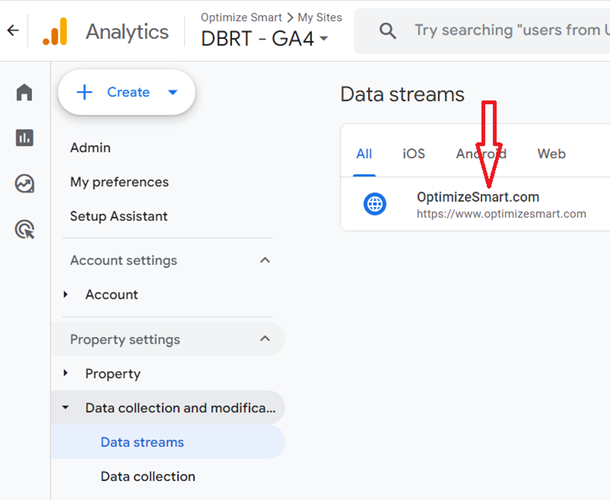
Step-3: Click on a web data stream.
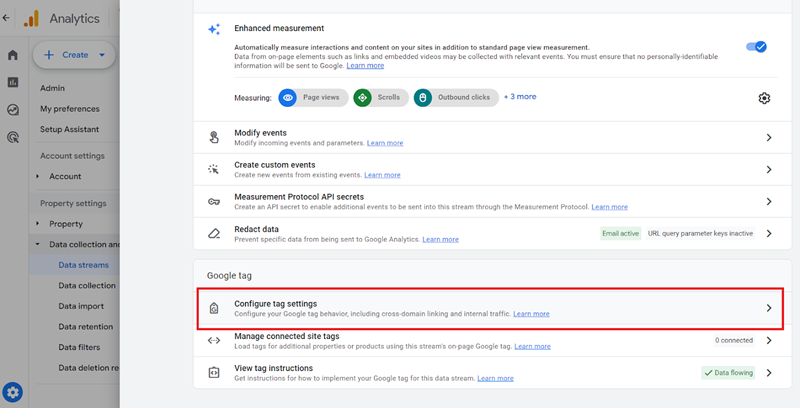
Step-4: Scroll down and click on the ‘Configure tag settings‘ link under the ‘Google Tag‘ section.
Step-5: Click on the ‘Admin‘ tab.
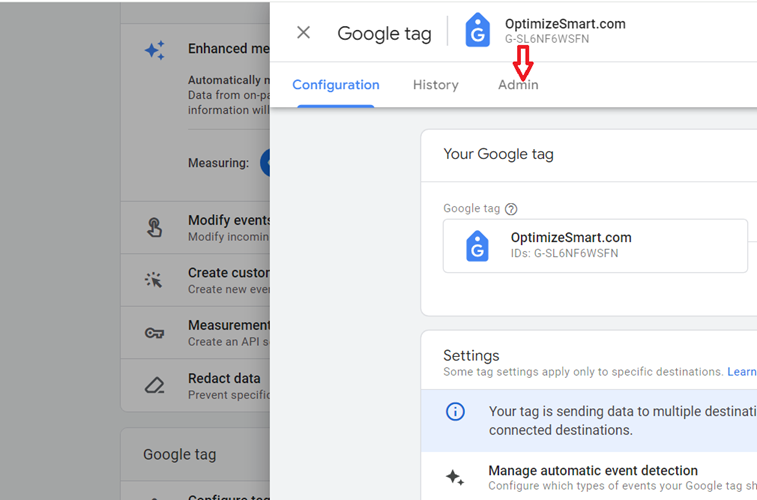
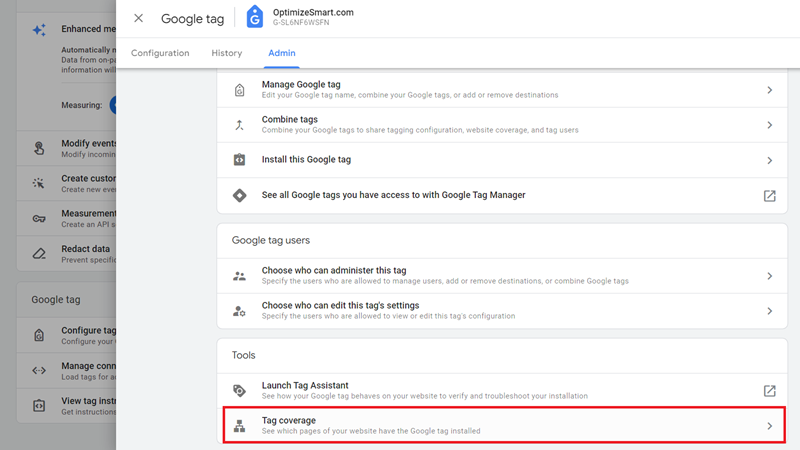
Step-6: Scroll down to the bottom and click on the ‘Tag coverage‘ link:
Step-7: Click on the tab ‘No recent activity‘.
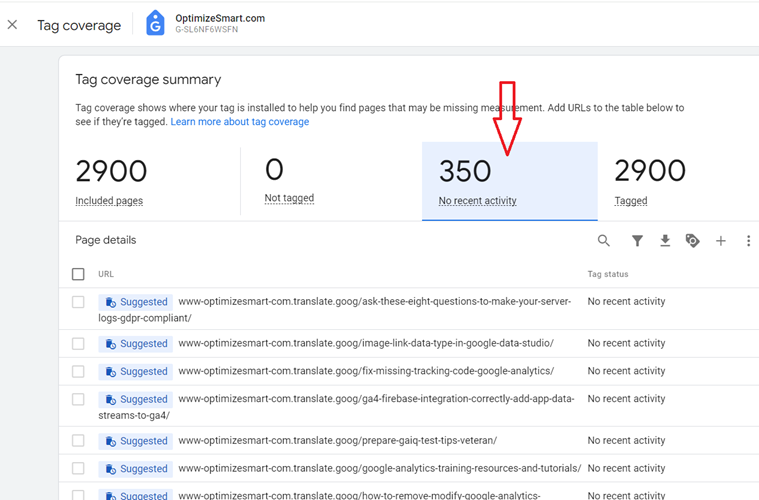
‘No recent activity’ refers to the web pages that have not loaded your Google tag in the last 30 days but have in the past.
In the context of the GA4 Tag Coverage report, it is mostly accurate to assume that tags with no recent activity are the web pages which have not received any traffic in the last 30 days.
However, here I am assuming the following:
1) Your tracking setup has no known implementation issues.
2) The Google tag is loading and firing correctly on all web pages.
3) Your tag coverage summary report is reporting on all the website URLs.
If you notice that the ‘Tag Coverage’ summary report does not include all of the pages from your website, you should import URLs by clicking on the + button.
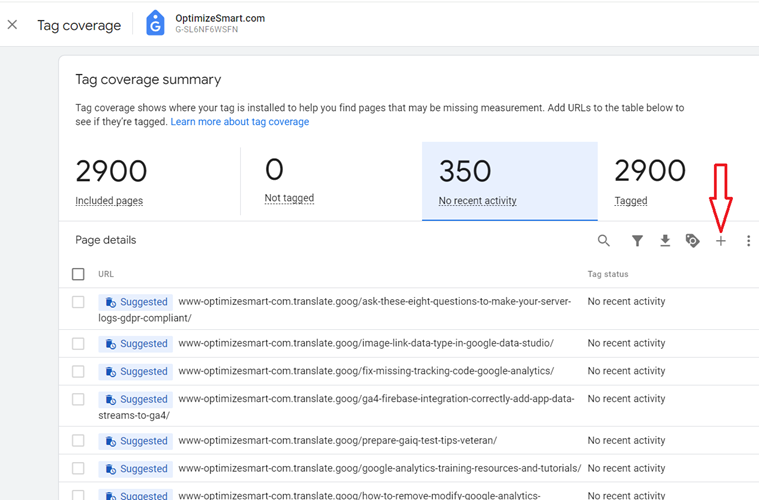
Select either ‘Add URLs‘ or ‘Upload a CSV file‘.
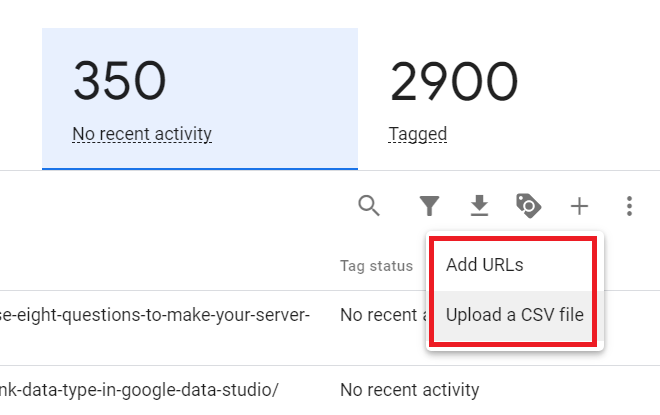
After importing the URLs, wait 24 to 48 hours before checking the summary report again.
Step-8: Click on the download button to download the tag coverage report:
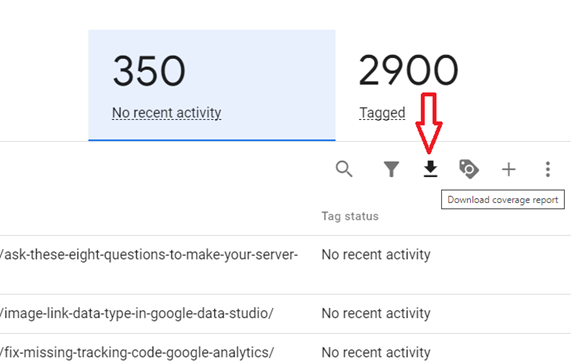
Step-9: Update the articles or repurpose them.
Related Article: Stop Trusting GA4/GTM Tag Coverage Report – Do This Instead.
Using Screaming Frog SEO Spider to track web pages with zero pageviews (Highly recommended).
Screaming Frog SEO Spider is a powerful website crawler which is popular among SEO professionals for finding and fixing crawling, indexing and other technical SEO issues.
I use Screaming Frog for tag auditing and for tracking web pages with zero pageviews in a particular time period.
You will need to use the paid version of Screaming Frog as Google Analytics integration is available only in the paid version.
Follow the steps below to track web pages with zero pageviews in the last 30 days:
#1 Launch the Screaming Frog SEO Spider tool on your computer.
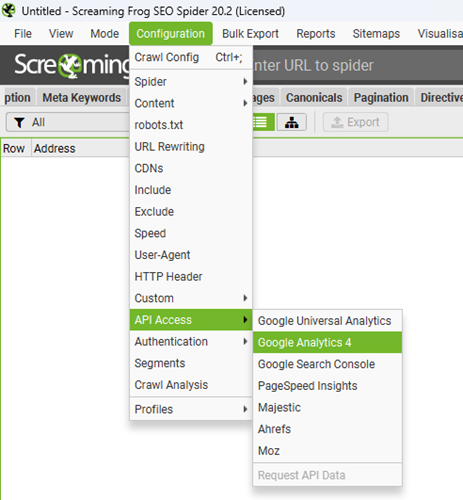
#2 Navigate to ‘Configuration’ > ‘API Access’ > ‘Google Analytics 4’
#3 Click on the button ‘Sign in with Google’:
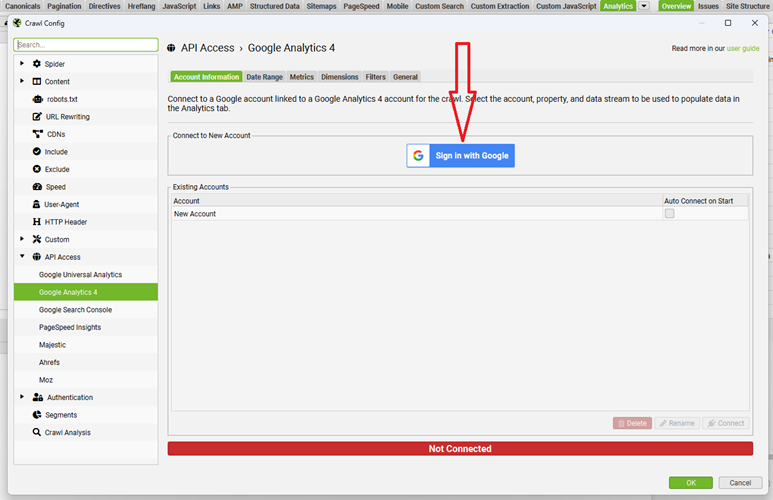
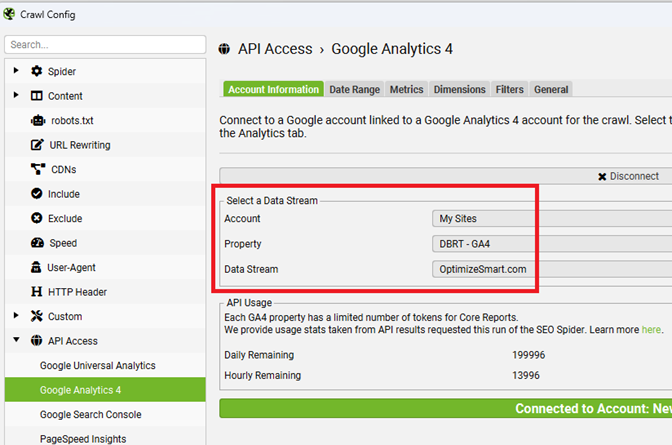
#4 Once you have signed in with your Google account, select the appropriate Google Analytics account, GA4 property and data stream:
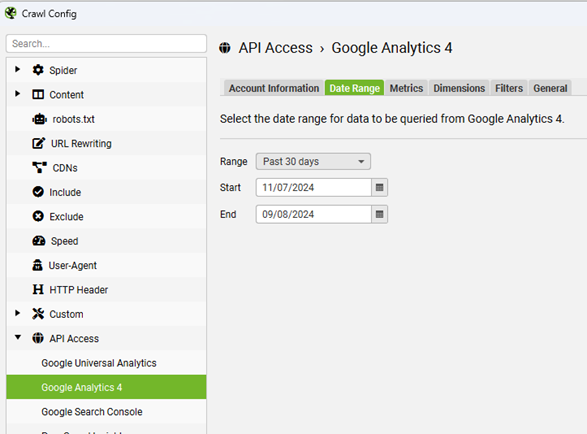
#5 Click on the ‘Date Range’ tab and set the date range to ‘Past 30 days’ (or whatever you prefer):
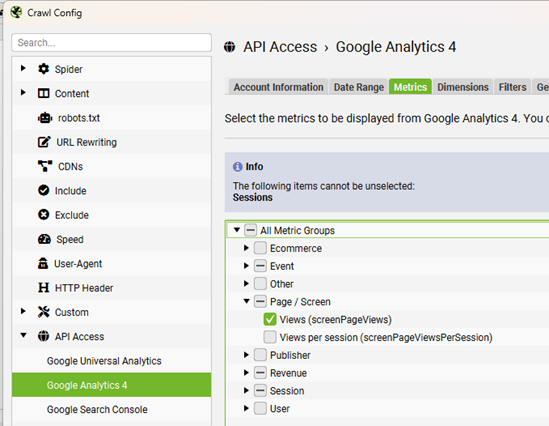
#6 Click on the ‘Metrics’ tab and then click on ‘Views (screenPageViews)’ under ‘Page / Screen’:
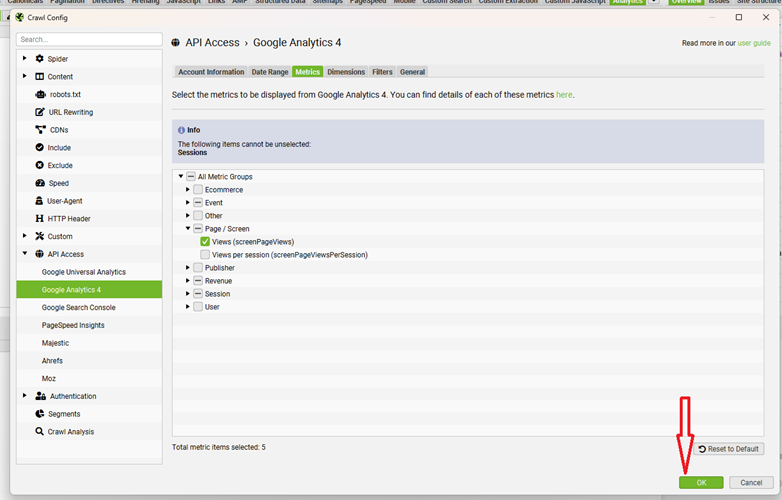
#7 Click on the ‘Ok’ button:
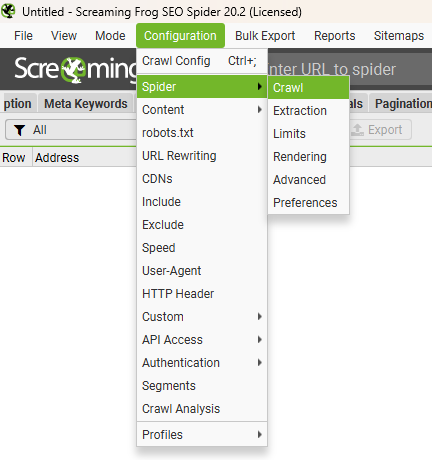
#8 Navigate to ‘Configuration’ > ‘Spider’ > ‘Crawl’
#9 Uncheck the following checkboxes to speed up your website crawl and then click on the ‘Ok’ button:
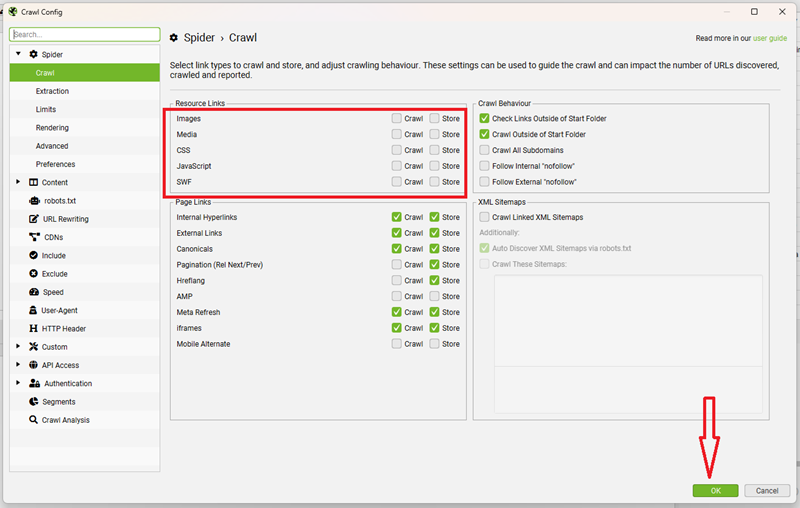
I have unchecked these resources so that Screaming Frog does not crawl images, media, CSS, JavaScript and SWF files during the crawl.
By not crawling these resources, you will greatly reduce the crawling time, especially if your website has hundreds or thousands of web pages.
#10 Enter your full website URL and then click on the ‘Start’ button:
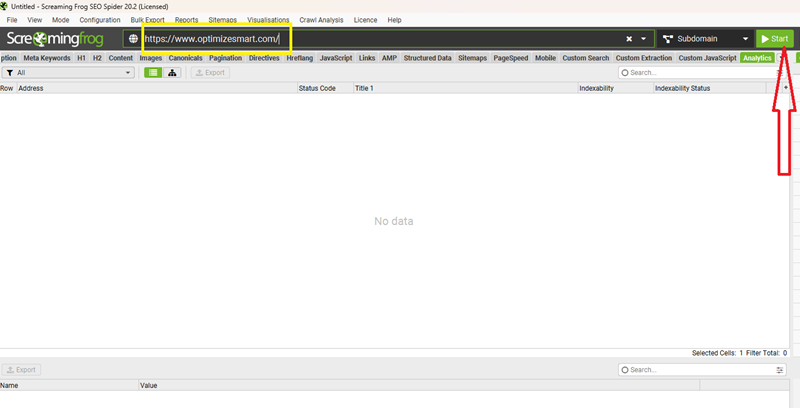
Screaming Frog will now crawl your website and pull in the GA4 data for each page.
#11 Once the crawl is complete, find and click on the ‘Analytics’ tab:
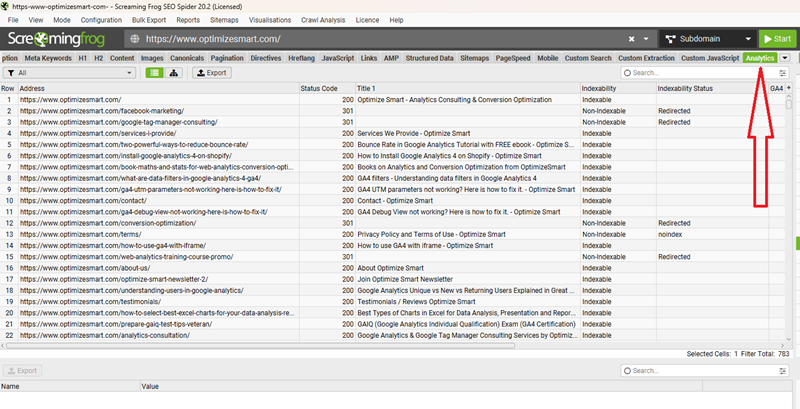
#12 Sort the pages by the Pageviews metric in ascending order by clicking on the column header ‘GA4 Views’:
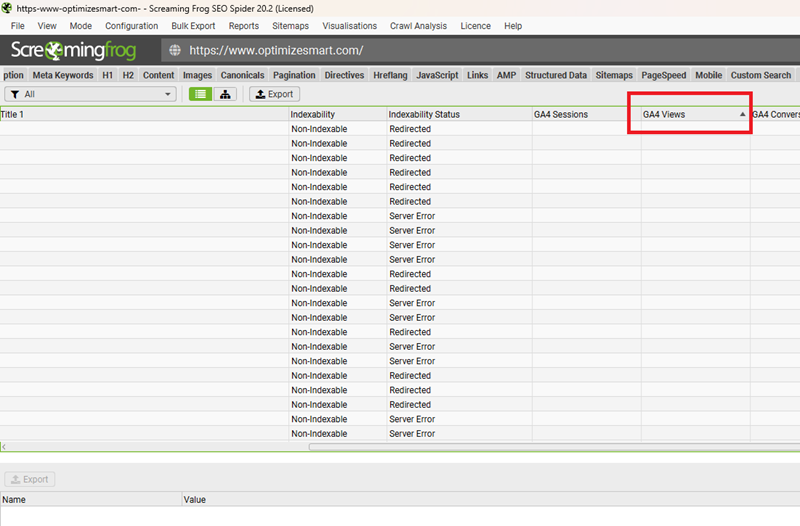
You should now see the list of web pages for which there is no data under the ‘GA4 Views’ column.
These are the web pages with zero pageviews in the last 30 days.
#13 Click on the ‘Export’ button to download this report:
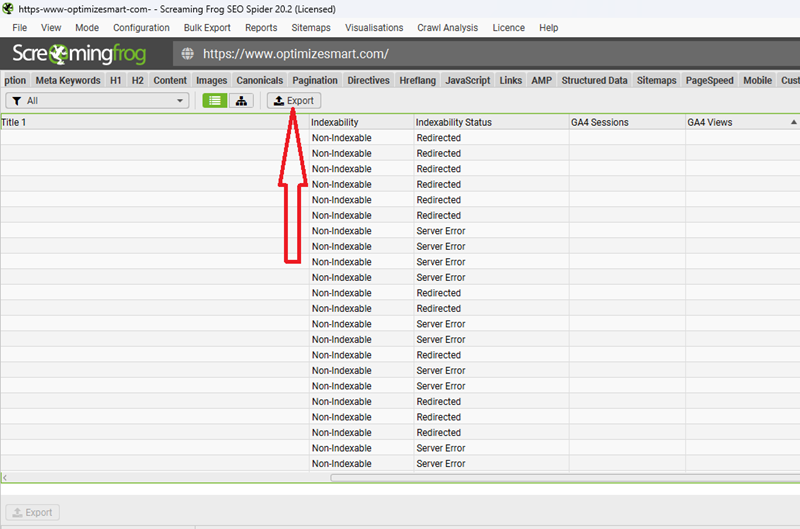
After exporting the report, you can either choose to optimize these web pages for traffic or delete them from your website.

Other Articles on GA4.
- Filter Google Analytics 4 Reports by UTM Parameters.
- Tracking 404 pages (broken links) in Google Analytics 4.
- How to identify the scope of any GA4 Dimension or Metric.
- You are doing Google Analytics all wrong. Here is why.
- How to check if Google Tag Manager is Working – Testing GTM.
- Setting up Facebook Conversion API via Google Tag Manager (GTM).
- Understanding Google Tag Manager Container Tag.
- Google Analytics Debugger, GTM Debugger Tutorial.
- Tracking web pages with zero pageviews in Google Analytics 4.
- How to Connect Google Analytics 4 with BigQuery.
- 100+ Google Analytics Remarketing Audiences for Retargeting.
- Google Tag Manager Workspaces Tutorial.
- Stop Trusting GA4/GTM Tag Coverage Report – Do This Instead.
- Some of your pages are not tagged in GTM/GA4 [Fixed].
- Tracking single page apps in Google Analytics via GTM.
- Anonymize IP in Google Analytics, gtag & Google Tag Manager.
- Matomo vs Google Analytics vs Piwik Pro - Best Google Analytics Alternative.
- Are You Waiting 12 Days Before Analyzing GA4 Data?
- Using Element Visibility Trigger in Google Tag Manager (GTM).
- Google Analytics Javascript Tutorial.