

Here is how you can determine when users are most likely to visit your website in BigQuery.
Step-1: Convert ‘event_timestamp’ into a date object. The formatted ‘event_timestamp’ may look like the one below: 2024-11-23 07:05:30.985585 UTC
Step-2: Once the ‘event_timestamp’ is formatted, segment the converted values into ‘Morning’, ‘Afternoon’, ‘Evening’ and ‘Night’.
Following is my definition:
Night is defined as the time between 12:00 AM and 6:00 AM.
Morning is defined as the time between 6:01 AM and 12:00 PM.
Afternoon is defined as the time between 12:01 PM and 6:00 PM.
Evening is defined as the time between 6:01 PM and 12:00 AM.
Extract the time part from each ‘event_timestamp’ and then put them in the following buckets: ‘Morning’, ‘Afternoon’, ‘Evening’ and ‘Night’.
Step-3: Count the total number of pageviews for ‘Morning’, ‘Afternoon’, ‘Evening’ and ‘Night’ to determine when users are most likely to visit your website.
Once you understand the logic, creating a text prompt becomes easy.
Use the following SQL (automatically generated via a text prompt in ChatGPT) to track peak time for Google Analytics 4 visits in BigQuery:
-- When users are most likely to visit your website

SELECT
  CASE
    WHEN EXTRACT(HOUR FROM TIMESTAMP_MICROS(event_timestamp)) BETWEEN 0 AND 5
      THEN 'Night'
    WHEN EXTRACT(HOUR FROM TIMESTAMP_MICROS(event_timestamp)) BETWEEN 6 AND 11
      THEN 'Morning'
    WHEN EXTRACT(HOUR FROM TIMESTAMP_MICROS(event_timestamp)) BETWEEN 12 AND 17
      THEN 'Afternoon'
    WHEN EXTRACT(HOUR FROM TIMESTAMP_MICROS(event_timestamp)) BETWEEN 18 AND 23
      THEN 'Evening'
    END AS `Time of the day`,
  COUNTIF(event_name = 'page_view') AS Pageviews
FROM
  `dbrt-ga4.analytics_207472454.events_*`
WHERE
  _TABLE_SUFFIX
  BETWEEN FORMAT_DATE('%Y%m%d', DATE('2024-10-01'))
  AND FORMAT_DATE('%Y%m%d', DATE('2024-10-31'))
GROUP BY
  `Time of the day`
ORDER BY
  Pageviews DESC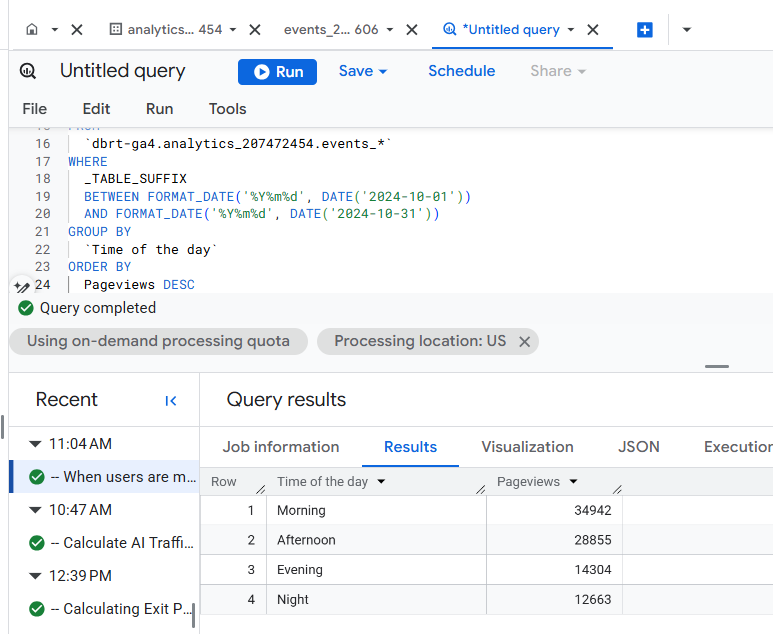
I am not a fan of cookie-cutter reports. But if you want one, this one could be for you.
All you have to do is supply your table ID to generate SQL that works for you.
If you want to customize this report according to your unique data analysis requirements then you need to understand the “logic” used behind calculating the various metrics in this report.
Once you understand the logic, customizing this report is easy peasy.
I teach you such logic in my GA4 BigQuery course, where you can learn to automate SQL generation via text prompts in ChatGPT.

There could be ‘N’ use cases, and it won’t be possible to provide ready-made SQL code for every possible case.
So, it is better that you understand the logic to scale SQL generation to the moon.
The future belongs to those who can query raw GA4 data in BigQuery, apply SQL logic, automate SQL generation via AI and drive insights beyond what GA4 UI can offer.
Related Articles:
- How to create GA4 Site Search Tracking report in BigQuery.
- How to track outbound / external links in GA4 BigQuery data table.
- How to track GA4 BigQuery Schema Change.
- Stop Splitting GA4 Tables in BigQuery Keep Them Nested.
- How To Correctly Calculate GA4 Active Users in BigQuery.
- How to Calculate GA4 Engaged Users in BigQuery.
- Stop Chasing GA4 Backfills in BigQuery.
- Google Analytics 4 Scroll Tracking Report in BigQuery.
- Google Analytics 4 Landing Page Report in BigQuery.
- Google Analytics 4 Exit Page Report in BigQuery.
- Google Analytics 4 Landing Page Dimension in BigQuery.
- GA4 (not set) Landing Pages Show 0 Entrances in BigQuery.
- Google Analytics 4 Page Title, Page Path & Views in BigQuery
- Google Analytics 4 Unique Pageviews in BigQuery.
- Google Analytics 4 Traffic Attribution in BigQuery.
- Finding Real Google Analytics 4 Conversion Paths in BigQuery.
- Tracking Google Analytics 4 UTM Parameters in BigQuery.
- Tracking Google Analytics 4 AI Traffic in BigQuery.
- Tracking peak time for Website Traffic in GA4 BigQuery.
- How to Correctly Work With Google Analytics Data Types in BigQuery.